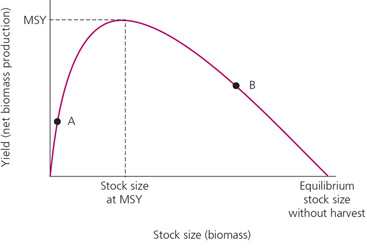
According to the model illustrated in the figure below, the greatest long-term harvest of fish is achieved when the stock size is managed to be
near its equilibrium size.
below its equilibrium, but still relatively high (point B on the figure).
below its equilibrium and where net biomass production is maximized.
far below its equilibrium (point A on the figure).
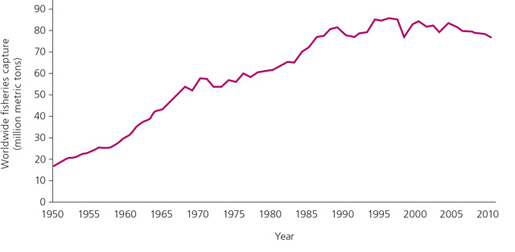
According to the data shown in the figure, the worldwide capture of fish for consumption increased steadily from the 1950s through the mid-1980s but has since leveled off. This leveling off has occurred primarily because
global demand for fish has leveled off.
fishing effort has leveled off.
the abundance of fish in the ocean has been reduced by overfishing.
All of the above
Catch does not necessarily reflect abundance of fish in the oceans because the total catch fluctuates as a result of
changes in fishing effort. Ideally, catch data would be standardized by the amount of effort (catch per unit effort, or CPUE).
changing regulations and restrictions.
changes in demand and economic markets.
All of the above
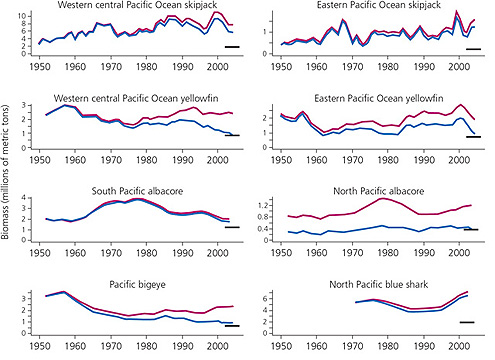
Stock assessment models were used to estimate the biomass of fish stocks at current levels of harvest (blue) and in the absence of harvest (red). Black bars indicate the biomass that would provide the maximum sustainable yield. The graphs lend support to which of the following statements?
The eight stocks shown in this figure are NOT overharvested.
The eight stocks shown in this figure are overharvested.
The eight stocks shown in this figure are all being managed below the level that would provide the maximum sustainable yield.
None of the above
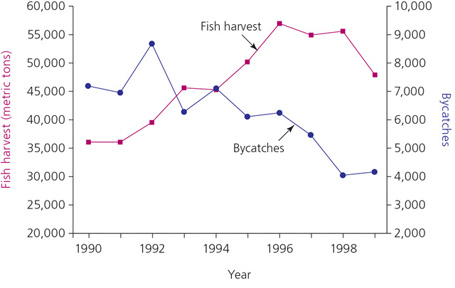
Which of the following statements best describes the point illustrated by the figure below?
Increasing fish harvest causes a reduction in bycatch of marine mammals.
Decreasing bycatch of marine mammals causes an increase in fish harvest.
By closing fishing areas during times when marine mammal encounters were especially likely and employing techniques to scare away marine mammals, bycatch of marine mammals was successfully reduced despite a simultaneous increase in fish harvest.
All of the above
The mean trophic level of captured fishes has been declining, and this has been interpreted to mean that top predators have been depleted and harvest is now focusing on organisms at lower trophic levels. However, the declining trophic level of captured fishes might also result from
a shift in people’s dietary preferences for different marine species.
changes in regulations limiting the amount of capture in various fisheries.
changing economic value of different marine species.
All of the above
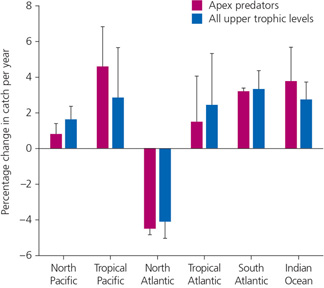
The data shown in the figure below lend support to which of the following statements?
The decline in the mean trophic level of harvested fishes could be due to sequential depletion in the North Atlantic but is likely due to sequential addition of lower trophic level species in the other regions shown in this figure.
The decline in the mean trophic level of harvested fishes could be due to sequential addition of lower trophic level species in the North Atlantic but is likely due to sequential depletion in the other regions shown in this figure.
The decline in the mean trophic level of harvested fishes is likely due to sequential depletion in all regions shown in this figure.
None of the above
The “tragedy of the commons” problem can be avoided or at least reduced in marine fisheries by
enforcing regulations such as catch limits, a prescribed fishing season, or restrictions on the sex or minimum size of harvestable fish.
establishing no-take zones or other forms of marine protected areas.
issuing a fixed number of shares that provide ownership of a certain proportion of the total catch in a designated area.
All of the above
Potential environmental risks associated with aquaculture include all of the following except:
farming of fish can cause thermal stress to the surrounding environment because aquaculture pens are typically heated to encourage rapid growth of fish.
farmed fish may be sources of disease and parasites for wild fish populations.
farmed fish may have higher concentrations of contaminants in their flesh in comparison to wild-caught fish.
farming of carnivorous fish may rely on the capture of wild fish to serve as feed.