If you used a Lincoln–Petersen mark-recapture approach to estimate the size of an animal population, but the tags were defective and fell off some percentage of the originally sampled individuals, the method would tend to
underestimate the true population size.
overestimate the true population size.
either underestimate or overestimate the true population size, depending on how many individuals lost their tags.
None of the above
If you used a Lincoln–Petersen mark-recapture approach to estimate the size of an animal population, but the tags were attractive to predators, the method would tend to
underestimate the true population size.
overestimate the true population size.
either underestimate or overestimate the true population size, depending on how much higher the predation rate is for tagged individuals.
None of the above
If you used a Lincoln–Petersen mark-recapture approach to estimate the size of an animal population, but tagging individuals affected their probability of recapture, the method would tend to
underestimate the true population size.
overestimate the true population size.
either underestimate or overestimate the true population size, depending on whether tagging increases or decreases the probability of recapture.
None of the above
Using a species' current level of genetic diversity to estimate its historic population size requires data, or at least a range of assumptions, about all of the following, except
the rate of mutation.
the species' current effective population size.
the strength of natural selection.
the species' generation time.
The 30-year-long effort in India to census the nation’s tiger population could have been improved by any of the following, EXCEPT
hiring more people to conduct a more thorough search for pugmarks.
tracking the amount of time spent searching for pugmarks.
tracking the location of pugmarks as they were found.
None of the above
This simple model of exponential population change, Nt+ 1 = λNt, assumes all of the following, except
constant environmental conditions.
an unlimited supply of resources (food, space, etc.).
completely random mating.
identical probabilities of survival and reproduction across all individuals.
If population growth rates over three periods are λ = 0.9, 1.2, and 0.8, the realized rate of change would be
0.967.
0.939.
0.952.
None of the above
Imagine you want to build a demographic matrix model for a population of a long-lived shrub species that flowers year after year. You would likely want to use a model that is
age-based.
stage-based.
size-based.
any of the above.
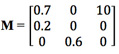
A population of biennial plants (plants that reproduce only in their second year of life and then die) consists of 150 seeds, 25 one-year-old (vegetative) plants, and 10 two-year-old (flowering) plants. If the demographic matrix for the population is , then in the next year the population will consist of
110 seeds, 6 one-year-old plants, and 1,500 two-year-old plants.
205 seeds, 30 one-year-old plants, and 15 two-year-old plants.
100 seeds, 30 one-year-old plants, and 15 two-year-old plants.
It is impossible to say given the information provided here.
If the demographic matrix for a population of biennial plants (composed of seeds, 1-year-old plants, and 2-year-old plants) is, what percentage of seeds dies each year?
10%
20%
60%
70%
To perform even the most basic population viability analysis requires all of the following, except an estimate of the
population growth rate.
starting population size.
rate of movement among subpopulations.
variability in the population growth rate.
Population viability analysis (PVA) can be used to estimate
the probability of extinction within some specified time period.
the expected (average) population size at some specified future time.
the range of population sizes that is likely (say with 95% confidence) at some specified future time.
 , then in the next year the population will consist of
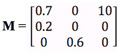 , what percentage of seeds dies each year?