Measures of Species Diversity
A measure of species diversity should have several properties. First, it should give a higher value for a community with many species than for one with fewer species, all else being equal. In other words, the ideal measure should be sensitive to species richness. Second, it should give a higher value for a community in which all species are equally abundant than for one in which some species are abundant and others are rare. That is, the ideal measure should also be sensitive to species evenness. In fact, the measure should give the maximum diversity value for a community of s different species when all the species are equally abundant, that is, when each species contributes a proportion 1/s of all the individuals in the community. This is the condition of maximum possible evenness.
Ecologists have adopted various measures with these properties from other scientific fields. Here we will discuss the most commonly used measure of species diversity, known as the Shannon Index after Claude Shannon, the mathematician and electrical engineer who proposed it in 1948. The Shannon Index is:

Where H is the Shannon Index, s is the number of species in the community, pi is the proportion of all the individuals in the community that belong to the ith species, and ln denotes a natural logarithm.
The Shannon Index has an interesting history. Claude Shannon was a pioneer in the early days of computers, when the theory that led to the first digital computers was being developed. His original formula used logarithms to base 2 rather than natural logarithms to base e. He chose base 2 so that the formula would measure the "information" needed to specify a series of binary (yes-no) digits, or "bits." Consider a binary message that consists of a string of zeroes and ones. What is the identity of any digit in this string, chosen at random? The identity of this digit is most uncertain (and takes the most "information" to specify) when the zeroes and ones occur in random order and are equally common overall. This is the situation in which the value of H is largest (whether one uses logarithms to base 2 or to base e in the formula). It may be most useful to think of H as a measure of uncertainty.
Translating into ecology, think of a community made up of individuals of different species. Imagine that you choose an individual at random; which species will it belong to? The identity of the individual is most uncertain—and the species diversity is highest—when there are many species (richness is high) and they are in equal proportions (evenness is maximized). H has the correct property of increasing in value as species richness and evenness increase.
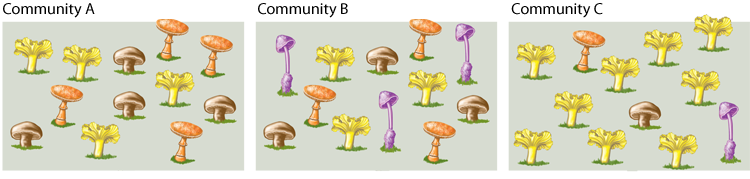
To become more familiar with the properties of the Shannon Index, use it to calculate H for the three mushroom communities in Figure 44.7. To calculate H, first calculate the proportion of individuals in each community that belong to each distinct species. Then take the natural logarithm of this proportion, and multiply the result by the proportion itself. Then add together the resulting values for the different species. Don't forget the minus sign in front of the summation symbol in the formula!
| Size of each population (separate with ,) = | |
| H = | |
Answer the following questions:
1. Which community or community has the lowest species richness? [Answer]
2. Which community has the lowest species evenness? [Answer]
3. Which community of the three has the highest species diversity, and why? [Answer]
Textbook Reference: Concept 44.3 Community Structure Affects Community Function