
Problems: Supply 1
Once students have completed Prelectures and Bridges, instructors can assign Problems as either Practice or post-lecture homework.
Next
Once students have completed Prelectures and Bridges, instructors can assign Problems as either Practice or post-lecture homework.
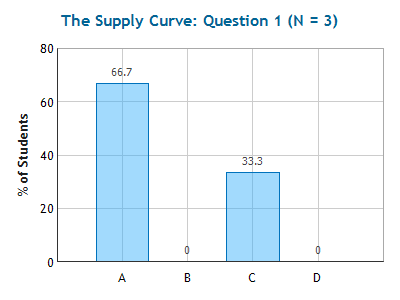
Next1) The supply curve slopes up and to the right because:
a) producers feel that people will buy more if they charge a higher price because they will think the product is more valuable.
b) producers feel that people will buy more if they charge a higher price to avoid the possibility of a shortage.
c) due to increasing opportunity costs, producers must charge more to produce more in order to cover their costs.
d) the opportunity cost of producing a product usually decreases as more is produced.
Right Answer: C 2
Each unit has between 30-50 Problems. All non-definitional problems feature video feedback provided by the authors themselves.
Next
Each unit has between 30-50 Problems. All non-definitional problems feature video feedback provided by the authors themselves.
Next
Feedback: Correct, supply curves have a positive slope because costs of production increase as output increases.
Wrong Answer:

Feedback: Supply curves have a positive slope because costs of production increase as output increases.
Wrong Answer:
Feedback: Supply curves have a positive slope because costs of production increase as output increases.
Wrong Answer:
Feedback: Supply curves have a positive slope because costs of production increase as output increases.
When pasting the graph into PowerPoint, make sure to Paste as Picture
(or Paste Special > Bitmap for older versions of PPT).
+ Add New Question
Problems
Edit Assignments
View Tim on Assignments
Print Assignment View
1) Supply (5)
1) Supply
1) Supply
1) Supply
1) Supply
3FlipIt Problems appear in Mastery Clusters, where each cluster covers a single topic. Students do not receive credit for the cluster until they answer a question in the cluster correctly, making it easy for students to see which topics they are struggling with.
Resources »