
Page 62 - 2021-bfw-SPA-4e-TE-sample.indd
P. 62
LESSON 2.6 • Normal Distributions: Finding Values from Areas 143
EXAMPLE TEACHING TIP:
How tall are 7-year-old girls? Differentiate
Finding the mean or SD from percentiles For students who find algebra
challenging, they can circumvent the Lesson 2.6
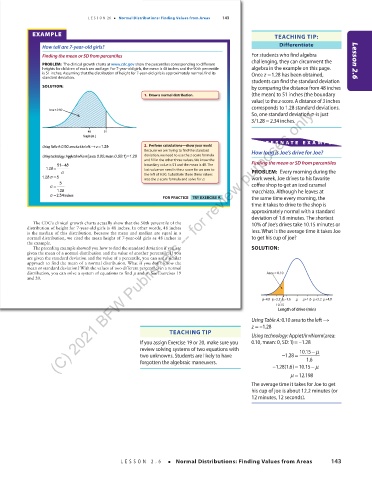
PROBLEM: The clinical growth charts at www.cdc.gov show the percentiles corresponding to different
heights for children of each sex and age. For 7-year-old girls, the mean is 48 inches and the 90th percentile algebra in the example on this page.
is 51 inches. Assuming that the distribution of height for 7-year-old girls is approximately normal, find its Once z =1.28 has been obtained,
standard deviation.
students can find the standard deviation
SOLUTION: by comparing the distance from 48 inches
1. Draw a normal distribution. (the mean) to 51 inches (the boundary
value) to the z-score. A distance of 3 inches
(C) 2021 BFW Publishers -- for review purposes only.
corresponds to 1.28 standard deviations.
Area = 0.90
So, one standard deviation σ is just
=
3/1.282.34 inches.
48 51
Height (in.)
AL TERNA TE EX AMPLE
Using Table A : 0.90 areato theleft →=1.28 2. Perform calculations—show your work!
z
Because we are trying to find the standard How long is Joe’s drive for Joe?
=
Using technology: Applet/invNorm(area:0.90,mean:0,SD:1)1.28 deviation, we need to use the z -score formula
and fill in the other three values. We know the
51 −48 boundary value is 51 and the mean is 48. The Finding the mean or SD from percentiles
1.28 = last value we need is the z -score for an area to
σ the left of 0.90. Substitute these three values PROBLEM: Every morning during the
1.28 σ =3 into the z -score formula and solve for s. work week, Joe drives to his favorite
3 coffee shop to get an iced caramel
σ =
1.28 macchiato. Although he leaves at
σ =2.34inches
FOR PRACTICE TRY EXERCISE 9. the same time every morning, the
time it takes to drive to the shop is
approximately normal with a standard
deviation of 1.6 minutes. The shortest
The CDC’s clinical growth charts actually show that the 50th percentile of the 10% of Joe’s drives take 10.15 minutes or
distribution of height for 7-year-old girls is 48 inches. In other words, 48 inches less. What is the average time it takes Joe
is the median of this distribution. Because the mean and median are equal in a
normal distribution, we cited the mean height of 7-year-old girls as 48 inches in to get his cup of joe?
the example.
The preceding example showed you how to find the standard deviation if you are SOLUTION:
given the mean of a normal distribution and the value of another percentile. If you
are given the standard deviation and the value of a percentile, you can use a similar
approach to find the mean of a normal distribution. What if you don’t know the
mean or standard deviation? With the values of two different percentiles in a normal
distribution, you can solve a system of equations to find µ and σ See Exercises 19 Area = 0.10
.
and 20 .
–4.8 –3.2 –1.6 +1.6 +3.2 +4.8
10.15
Length of drive (min)
Using Table A: 0.10areatotheleft S
z = –1.28
03_StarnesSPA4e_24432_ch02_088_153.indd 143 07/09/20 1:58 PM
TEACHING TIP
Using technology: Applet/invNorm(area:
=
If you assign Exercise 19 or 20, make sure you 0.10, mean:0,SD:1) –1.28
review solving systems of two equations with 10.15 µ
−
two unknowns. Students are likely to have − 1.28 =
forgotten the algebraic maneuvers. 1.6
− 1.28(1.6) 10.15 µ= −
µ = 12.198
The average time it takes for Joe to get
his cup of joe is about 12.2 minutes (or
12 minutes, 12 seconds).
LESSON 2.6 • Normal Distributions: Finding Values from Areas 143
03_TysonTEspa4e_25177_ch02_088_153_4pp.indd 143 10/11/20 7:48 PM