
Page 60 - 2021-bfw-SPA-4e-TE-sample.indd
P. 60
LESSON 2.6 • Normal Distributions: Finding Values from Areas 141
Applet TI-83/84
1. Press 2nd VARS (Distr) and choose invNorm(.
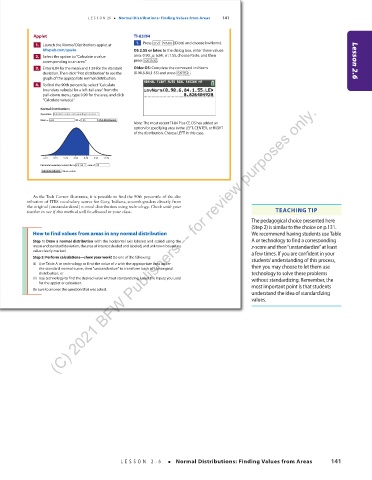
1. Launch the Normal Distributions applet at
bfwpub.com/spa4e. OS 2.55 or later: In the dialog box, enter these values:
2. Select the option to “Calculate a value area: 0.90, µ:6.84, σ :1.55, choose Paste, and then
corresponding to an area.” press ENTER . Lesson 2.6
3. Enter 6.84 for the mean and 1.55 for the standard Older OS: Complete the command invNorm
deviation. Then click “Plot distribution” to see the (0.90,6.84,1.55) and press ENTER .
graph of the appropriate normal distribution.
4. To find the 90th percentile, select “Calculate
boundary value(s) for a left-tail area” from the
pull-down menu, type 0.90 for the area, and click
“Calculate value(s).”
(C) 2021 BFW Publishers -- for review purposes only.
Normal Distributions
Operation: Calculate a value corresponding to an area
Mean = 6.84 SD = 1.55 Plot distribution
Note: The most recent TI-84 Plus CE OS has added an
option for specifying area in the LEFT, CENTER, or RIGHT
of the distribution. Choose LEFT in this case.
2.19 3.74 5.29 6.84 8.39 9.94 11.49
Calculate boundary value(s) for a left-tail area of .90
Calculate value(s) Value = 8.826
As the Tech Corner illustrates, it is possible to find the 90th percentile of the dis-
tribution of ITBS vocabulary scores for Gary, Indiana, seventh-graders directly from
the original (unstandardized) normal distribution using technology. Check with your
teacher to see if this method will be allowed in your class. TEACHING TIP
The pedagogical choice presented here
(Step 2) is similar to the choice on p.131.
How to find values from areas in any normal distribution We recommend having students use Table
Step 1: Draw a normal distribution with the horizontal axis labeled and scaled using the A or technology to find a corresponding
mean and standard deviation, the area of interest shaded and labeled, and unknown boundary z-score and then “unstandardize” at least
value clearly marked. a few times. If you are confident in your
Step 2: Perform calculations—show your work! Do one of the following: students’ understanding of this process,
(i) Use Table A or technology to find the value of z with the appropriate area under then you may choose to let them use
the standard normal curve, then “unstandardize” to transform back to the original
distribution; or technology to solve these problems
(ii) Use technology to find the desired value without standardizing. Label the inputs you used without standardizing. Remember, the
for the applet or calculator. most important point is that students
Be sure to answer the question that was asked.
understand the idea of standardizing
values.
03_StarnesSPA4e_24432_ch02_088_153.indd 141 07/09/20 1:57 PM
LESSON 2.6 • Normal Distributions: Finding Values from Areas 141
03_TysonTEspa4e_25177_ch02_088_153_4pp.indd 141 10/11/20 7:48 PM