
Page 55 - 2021-bfw-SPA-4e-TE-sample.indd
P. 55
136 CHAPTER 2 • Modeling One-Variable Quantitative Data
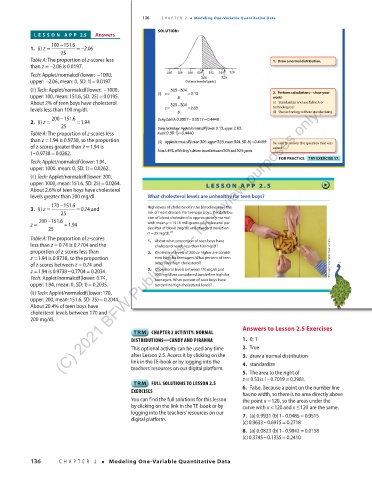
SOLUTION:
LESSON APP 2.5 Answers
100 −151.6
1. (i) z = =−2.06
25
Table A: The proportion of z-scores less 1. Draw a normal distribution.
than z = –2.06 is 0.0197.
Tech: Applet/normalcdf(lower:–1000, 280 288 296 304 305 312 320 328
325
upper: –2.06, mean:0,SD:1) = 0.0197 Distance traveled (yards)
(ii) Tech: Applet/normalcdf(lower:–1000, 305 −304 2. Perform calculations—show your
z
=
upper:100,mean:151.6, SD:25) 0.0195. (i) = 8 =0.13 work!
About 2% of teen boys have cholesterol 325 −304 (i) Standardize and use Table A or
(C) 2021 BFW Publishers -- for review purposes only.
=
levels less than 100 mg/dl. z 8 =2.63 technology; or
(ii) Use technology without standardizing.
200 −151.6 Using Table A : 0.9957 −0.5517 0.4440
=
2. (i) z = =1.94
25 Using technology: Applet/normalcdf(lower:0.13,upper:2.63,
Table A: The proportion of z-scores less mean:0,SD:1)0.4440
=
than z =1.94 is 0.9738, so the proportion (ii) Applet/normalcdf(lower:305,upper:325,mean:304,SD:8) 0.4459 Be sure to answer the question that was
=
of z-scores greater than z =1.94 is asked.
1–0.9738 = 0.0262. About 45% of McIlroy’s drives travel between 305 and 325 yards.
FOR PRACTICE TRY EXERCISE 17.
Tech: Applet/normalcdf(lower:1.94,
=
upper:1000,mean: 0, SD:1)0.0262.
(ii) Tech: Applet/normalcdf(lower: 200,
=
upper:1000,mean:151.6, SD:25) 0.0264. LESSON APP 2 . 5
About 2.6% of teen boys have cholesterol
levels greater than 200 mg/dl. What cholesterol levels are unhealthy for teen boys?
170 −151.6
3. (i) z = = 0.74 and High levels of cholesterol in the blood increase the
25 risk of heart disease. For teenage boys, the distribu-
200 −151.6 tion of blood cholesterol is approximately normal
z = =1.94 with mean µ = 151.6 milligrams of cholesterol per
25 deciliter of blood (mg/dl) and standard deviation
19
σ = 25 mg/dl .
Table A: The proportion of z-scores 1. About what proportion of teen boys have
less than z = 0.74 is 0.7704 and the cholesterol levels less than 100 mg/dl ?
proportion of z-scores less than 2. Cholesterol levels of 200 or higher are consid-
z =1.94 is 0.9738, so the proportion ered high for teenagers. What percent of teen Tim Macpherson/Cultura Creative/Alamy
of z-scores between z = 0.74 and boys have high cholesterol?
=
z =1.94 is 0.9738–0.7704 0.2034. 3. Cholesterol levels between 170 mg/dl and
Tech: Applet/normalcdf(lower:0.74, 200 mg/dl are considered borderline high for
teenagers. What percent of teen boys have
=
upper:1.94,mean: 0, SD:1)0.2035. borderline high cholesterol levels?
(ii) Tech: Applet/normalcdf(lower:170,
=
upper: 200,mean:151.6, SD:25) 0.2044.
About 20.4% of teen boys have
cholesterol levels between 170 and
200 mg/dl.
03_StarnesSPA4e_24432_ch02_088_153.indd 136 Answers to Lesson 2.5 Exercises 07/09/20 1:57 PM
CHAPTER 2 ACTIVITY: NORMAL
DISTRIBUTIONS CANDY AND PIRANHA 1. 0; 1
This optional activity can be used any time 2. True
after Lesson 2.5. Access it by clicking on the 3. draw a normal distribution
link in the TE-book or by logging into the 4. standardize
teachers’ resources on our digital platform.
5. The area to the right of
=
z = 0.53is1–0.7019 0.2981.
FULL SOLUTIONS TO LESSON 2.5
EXERCISES 6. False. Because a point on the number line
has no width, so there is no area directly above
You can find the full solutions for this lesson the point x =120, so the areas under the
by clicking on the link in the TE-book or by curve with x <120 and x ≤120 are the same.
logging into the teachers’ resources on our 7. (a) 0.9931 (b) 1–0.0485 0.9515
=
digital platform.
=
(c) 0.9633–0.69150.2718
=
8. (a) 0.0823 (b) 1–0.9842 0.0158
=
(c) 0.3745–0.1335 0.2410
136 CHAPTER 2 • Modeling One-Variable Quantitative Data
03_TysonTEspa4e_25177_ch02_088_153_4pp.indd 136 10/11/20 7:47 PM