
Page 50 - 2021-bfw-SPA-4e-TE-sample.indd
P. 50
LESSON 2.5 • Normal Distributions: Finding Areas from Values 131
TI-83/84 Note: We chose 1000 as the lower bound because
−
1. Press 2nd VARS (Distr) and choose normalcdf(. it’s many, many standard deviations less than the
mean.
OS 2.55 or later: In the dialog box, enter these values:
lower: −1000, upper: 4, µ:6.84, σ :1.55, choose Paste, This answer (0.0335) differs slightly from the one we
and then press ENTER . got using the standard normal distribution (0.0336) Lesson 2.5
because we rounded the standardized score to two
Older OS: Complete the command normalcdf decimal places: z =− 1.83.
−
( 1000,4,6.84, 1.55) and press ENTER .
(C) 2021 BFW Publishers -- for review purposes only.
As the Tech Corner illustrates, it is possible to find the proportion of Gary, Indiana,
seventh-graders with ITBS vocabulary scores less than 4 directly from the original
(unstandardized) normal distribution using technology. Check with your teacher to
see if this method will be allowed in your class.
TEACHING TIP
How to Find Areas in Any Normal Distribution
The pedagogical choice presented
Step 1: Draw a normal distribution with the horizontal axis labeled and scaled using the
mean and standard deviation, the boundary value(s) clearly identified, and the area of interest in Step 2 is to standardize or not to
shaded. standardize. With current technology,
Step 2: Perform calculations—show your work! Do one of the following: students can avoid standardizing values
(i) Standardize each boundary value and use Table A or technology to find the desired area to find areas under normal distributions.
under the standard normal curve; or However, the concept of standardization
(ii) Use technology to find the desired area without standardizing. Label the inputs you used is important. We recommend that you
for the applet or calculator.
Be sure to answer the question that was asked. ask students to standardize in several
problems before you consider allowing
them to skip standardizing values.
Standardized values give students a
EXAMPLE
single frame of reference for normal
distributions. It may not be obvious
Stop the car!
where 2.64 falls in a normal distribution
Finding area to the left in a normal distribution with mean 3.18 and standard deviation
PROBLEM: Many studies on automobile safety suggest that when drivers must make emergency stops, the 0.216, but knowing that the standardized
stopping distances follow an approximately normal distribution. Suppose that for one model of car traveling score for 2.64 is z = –2.5 gives a much
at 60 mph under typical conditions on dry pavement, the mean stopping distance is µ =165 feet with a stan-
dard deviation of σ = 4 feet. Marta is driving one of these cars when she spots an accident 170 feet in front of clearer understanding of the position of
her and needs to make an emergency stop. About what percent of cars of this model would be able to make 2.64 in that distribution. Monitor your
an emergency stop in less than 170 feet?
students as they practice finding areas
under normal distributions.
03_StarnesSPA4e_24432_ch02_088_153.indd 131 07/09/20 1:56 PM
AL TERNA TE EX AMPLE
Can you taste the sweet sugary
goodness? SOLUTION:
Finding area to the left in a normal
distribution
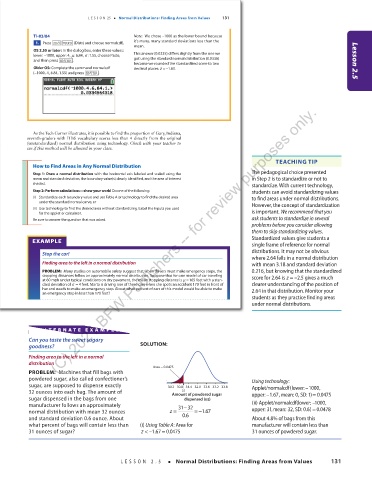
Area = 0.0475
PROBLEM: Machines that fill bags with
powdered sugar, also called confectioner’s Using technology:
sugar, are supposed to dispense exactly 30.2 30.8 31.4 32.0 32.6 33.2 33.8 Applet/normalcdf(lower:–1000,
32 ounces into each bag. The amount of Amount of powdered sugar upper:–1.67, mean:0,SD:1) 0.0475
31
=
sugar dispensed in the bags from one dispensed (oz)
manufacturer follows an approximately 31 −32 (ii) Applet/normalcdf(lower:–1000,
=
normal distribution with mean 32 ounces z = =−1.67 upper: 31,mean: 32,SD: 0.6) 0.0478
and standard deviation 0.6 ounce. About 0.6 About 4.8% of bags from this
what percent of bags will contain less than (i) Using Table A: Area for manufacturer will contain less than
=
31 ounces of sugar? z < –1.670.0475 31 ounces of powdered sugar.
LESSON 2.5 • Normal Distributions: Finding Areas from Values 131
03_TysonTEspa4e_25177_ch02_088_153_4pp.indd 131 10/11/20 7:46 PM