
Page 45 - 2021-bfw-SPA-4e-TE-sample.indd
P. 45
126 CHAPTER 2 • Modeling One-Variable Quantitative Data
18. The stemplot looks roughly distribution approximately normal? Justify your data are shown. Is this distribution approxi-
17
symmetric, single-peaked, and answer based on the graph and the empirical mately normal? Justify your answer based on the
somewhat bell-shaped. rule. graph and the empirical rule.
13 d d
Mean ±1SD:15.54 1(1.90) 13.64 to17.44 12 d d d d d d d d d d d d d d
±
38out of 51 = 74.5% 11 250 300 Calories 350 400
10
±
Mean ± 2SD:15.54 2(1.90) 11.74 to19.34 9 n Mean SD Min Med Max
Q 1
Q 3
46out of 51 = 90.2% 8 7 16 331.9 27.9 260 315 335 350 380
±
Mean ± 3SD:15.54 3(1.90)9.84to 21.24 Frequency 6 5
51out of 51 =100% 4 Applying the Concepts
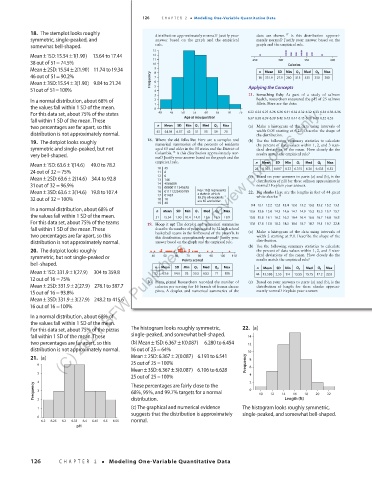
3 21. Something fishy As part of a study of salmon
In a normal distribution, about 68% of 2 health, researchers measured the pH of 25 salmon
fillets. Here are the data:
(C) 2021 BFW Publishers -- for review purposes only.
the values fall within 1 SD of the mean. 1 0
For this data set, about 75% of the states 40 45 50 55 60 65 70 75 6.22 6.24 6.25 6.26 6.26 6.31 6.32 6.32 6.32 6.33 6.34 6.36 6.36
fall within 1 SD of the mean. These Age at inauguration 6.37 6.38 6.39 6.39 6.42 6.43 6.44 6.45 6.48 6.48 6.52 6.53
two percentages are far apart, so this n Mean SD Min Q 1 Med Q 3 Max (a) Make a histogram of the data using intervals of
distribution is not approximately normal. 45 54.98 6.57 42 51 55 59 70 width 0.05 starting at 6.20. Describe the shape of
the distribution.
19. The dotplot looks roughly 18. Where the old folks live Here are a stemplot and (b) Use the following summary statistics to calculate
numerical summaries of the percents of residents
symmetric and single-peaked, but not aged 65 and older in the 50 states and the District of the percent of data values within 1, 2, and 3 stan-
dard deviations of the mean. How closely do the
16
very bell-shaped. Columbia. Is this distribution approximately nor- results match the empirical rule?
mal? Justify your answer based on the graph and the
±
Mean ±1SD: 63.61(14.6) 49.0 to 78.2 empirical rule. n Mean SD Min Q 1 Med Q 3 Max
10
45
24 outof32 = 75% 11 6 25 6.367 0.087 6.22 6.315 6.36 6.435 6.53
±
Mean ± 2SD: 63.62(14.6) 34.4to 92.8 12 0 146 (c) Based on your answers to parts (a) and (b), is the
13
distribution of pH for these salmon approximately
31out of 32 = 96.9% 14 4566689 normal? Explain your answer.
00000111345678
15
±
Mean ± 3SD: 63.63(14.6) 19.8to107.4 16 01111223455789 Key: 16|2 represents 22. Big sharks Here are the lengths in feet of 44 great
a state in which
17
01457
32out of 32 =100% 18 18 16.2% of residents white sharks: 18
19 49 are 65 and older. 9.4 12.1 12.2 12.3 12.4 12.6 13.2 13.2 13.2 13.2 13.5
In a normal distribution, about 68% of n Mean SD Min Med Max 13.6 13.6 13.8 14.3 14.6 14.7 14.9 15.2 15.3 15.7 15.7
Q 3
Q 1
the values fall within 1 SD of the mean. 51 15.54 1.90 10.4 14.8 15.6 16.5 19.9 15.8 15.8 16.1 16.2 16.2 16.4 16.4 16.6 16.7 16.8 16.8
For this data set, about 75% of the teams 19. Hoop it up! The dotplot and numerical summaries 17.6 17.8 17.8 18.2 18.3 18.6 18.7 18.7 19.1 19.7 22.8
fall within 1 SD of the mean. These describe the number of points scored by 32 high school
two percentages are far apart, so this basketball teams in the first round of the playoffs. Is (a) Make a histogram of the data using intervals of
width 2 starting at 9.0. Describe the shape of the
this distribution approximately normal? Justify your
distribution is not approximately normal. answer based on the graph and the empirical rule. distribution.
(b) Use the following summary statistics to calculate
20. The dotplot looks roughly the percent of data values within 1, 2, and 3 stan-
symmetric, but not single-peaked or 40 50 60 70 80 90 100 110 dard deviations of the mean. How closely do the
results match the empirical rule?
bell-shaped. Points scored
n Mean SD Min Q 1 Med Q 3 Max n Mean SD Min Q 1 Med Q 3 Max
±
Mean ±1SD: 331.91(27.9) 304 to 359.8 32 63.6 14.6 38 53.5 63.5 71 106 44 15.586 2.55 9.4 13.55 15.75 17.2 22.8
12out of 16 = 75% (c) Based on your answers to parts (a) and (b), is the
±
Mean ± 2SD: 331.92(27.9) 276.1to 387.7 20. Pizza, pizza! Researchers recorded the number of distribution of length for these sharks approxi-
calories per serving for 16 brands of frozen cheese
15out of 16 = 93.8% pizza. A dotplot and numerical summaries of the mately normal? Explain your answer.
±
Mean ± 3SD: 331.93(27.9) 248.2to 415.6
16out of 16 =100%
In a normal distribution, about 68% of
the values fall within 1 SD of the mean.
03_StarnesSPA4e_24432_ch02_088_153.indd 126
For this data set, about 75% of the pizzas The histogram looks roughly symmetric, 22. (a) 07/09/20 1:56 PM
fall within 1 SD of the mean. These single-peaked, and somewhat bell-shaped. 14
±
±
two percentages are far apart, so this (b) Mean 1SD: 6.367 1(0.087) 6.280 to 6.454 12
distribution is not approximately normal. 16out of 25 = 64% 10
±
21. (a) Mean ± 2SD: 6.367 2(0.087)6.193 to 6.541 8
6 25 outof25 =100% Frequency 6
Mean ± 3SD: 6.367 3(0.087)6.106 to 6.628
±
5
25 outof25 =100% 4
4 These percentages are fairly close to the 2
Frequency 3 2 68%, 95%, and 99.7% targets for a normal 0 10 12 14 Length (ft) 18 20 22
16
distribution.
1 (c) The graphical and numerical evidence The histogram looks roughly symmetric,
suggests that the distribution is approximately single-peaked, and somewhat bell-shaped.
0
6.2 6.25 6.3 6.35 6.4 6.45 6.5 6.55 normal.
pH
126 CHAPTER 2 • Modeling One-Variable Quantitative Data
03_TysonTEspa4e_25177_ch02_088_153_4pp.indd 126 10/11/20 7:46 PM