
Page 43 - 2021-bfw-SPA-4e-TE-sample.indd
P. 43
124 CHAPTER 2 • Modeling One-Variable Quantitative Data
The example shows that the distribution of amount of cream in Ryan and Allie’s
TEACHING TIP random sample of 45 Double Stuf Oreo cookies is approximately normal. As you will
,
learn in Chapter 4 random sampling allows us to generalize results from a sample
Assessing normality is important for to the larger population. It is therefore reasonable to believe that the distribution of
many techniques learned later in amount of cream in the population of Double Stuf Oreo cookies is approximately
normal. Assessing the normality of a population distribution is an important part of
this book, but not all distributions several inference methods that you will encounter in Chapters 8 – 11 .
are approximately normal. There are
alternate techniques for many of
those other distributions, but they’re LESSON APP 2 . 4
not covered in this textbook. Just like How big is your fridge?
people, some of the most interesting
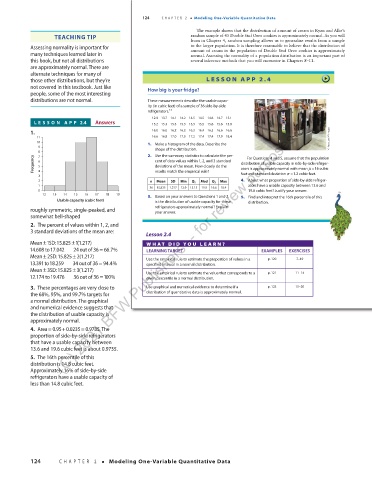
distributions are not normal. These measurements describe the usable capac-
(C) 2021 BFW Publishers -- for review purposes only.
ity (in cubic feet) of a sample of 36 side-by-side
13
refrigerators.
12.9 13.7 14.1 14.2 14.5 14.5 14.6 14.7 15.1
LESSON APP 2.4 Answers 15.2 15.3 15.3 15.3 15.3 15.5 15.6 15.6 15.8
1. 16.0 16.0 16.2 16.2 16.3 16.4 16.5 16.6 16.6
11 16.6 16.8 17.0 17.0 17.2 17.4 17.4 17.9 18.4 Wilfredo Lee/AP Images
10 1. Make a histogram of the data. Describe the
9 shape of the distribution.
8 7 2. Use the summary statistics to calculate the per-
Frequency 6 5 cent of data values within 1, 2, and 3 standard distribution of usable capacity in side-by-side refriger-
For Questions 4 and 5 , assume that the population
deviations of the mean. How closely do the
ators is approximately normal with mean µ =16 cubic
3 4 results match the empirical rule? feet and standard deviation σ =1.2 cubic feet.
2 n Mean SD Min Q 1 Med Q 3 Max 4. About what proportion of side-by-side refriger-
1 36 15.825 1.217 12.9 15.15 15.9 16.6 18.4 ators have a usable capacity between 13.6 and
0 19.6 cubic feet? Justify your answer.
12 13 14 15 16 17 18 19 3. Based on your answers to Questions 1 and 2 , 5. Find and interpret the 16th percentile of this
Usable capacity (cubic feet) is the distribution of usable capacity for these distribution.
roughly symmetric, single-peaked, and refrigerators approximately normal? Explain
your answer.
somewhat bell-shaped
2. The percent of values within 1, 2, and
3 standard deviations of the mean are:
Lesson 2.4
±
Mean ±1SD:15.825 1(1.217) WHA T DID Y OU LEARN ?
=
14.608 to17.042 24 outof3666.7% LEARNING TARGET EXAMPLES EXERCISES
±
Mean ± 2SD:15.825 2(1.217) Use the empirical rule to estimate the proportion of values in a p. 120 7–10
13.391to18.259 34 outof3694.4% specified interval in a normal distribution.
=
±
Mean ± 3SD:15.825 3(1.217) p. 121 11–14
=
12.174 to19.476 36 outof36100% Use the empirical rule to estimate the value that corresponds to a
given percentile in a normal distribution.
3. These percentages are very close to Use graphical and numerical evidence to determine if a p. 123 15–20
the 68%, 95%, and 99.7% targets for distribution of quantitative data is approximately normal.
a normal distribution. The graphical
and numerical evidence suggests that
the distribution of usable capacity is
approximately normal.
4. Area 0.95 0.0235 0.9735. The 03_StarnesSPA4e_24432_ch02_088_153.indd 124 07/09/20 1:56 PM
=
=
+
proportion of side-by-side refrigerators
that have a usable capacity between
13.6 and 19.6 cubic feet is about 0.9735.
5. The 16th percentile of this
distribution is 14.8 cubic feet.
Approximately 16% of side-by-side
refrigerators have a usable capacity of
less than 14.8 cubic feet.
124 CHAPTER 2 • Modeling One-Variable Quantitative Data
03_TysonTEspa4e_25177_ch02_088_153_4pp.indd 124 10/11/20 7:46 PM