
Page 39 - 2021-bfw-SPA-4e-TE-sample.indd
P. 39
120 CHAPTER 2 • Modeling One-Variable Quantitative Data
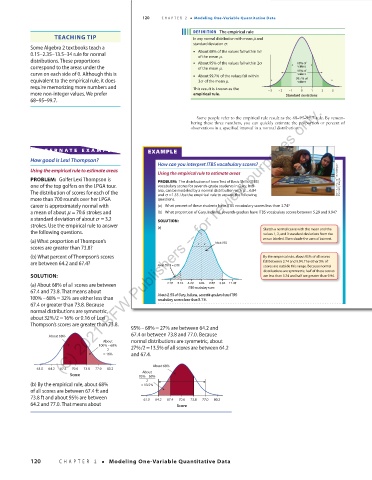
DEFINITION The empirical rule
TEACHING TIP In any normal distribution with mean µ and
standard deviation σ :
Some Algebra 2 textbooks teach a
0.15–2.35–13.5–34 rule for normal • About 68% of the values fall within σ1
distributions. These proportions of the mean µ . 68% of
correspond to the areas under the • About 95% of the values fall within σ2 values
of the mean µ .
curve on each side of 0. Although this is • About 99.7% of the values fall within 95% of
values
equivalent to the empirical rule, it does 3σ of the mean µ . 99.7% of
values
require memorizing more numbers and This result is known as the
–1
1
0
more non-integer values. We prefer empirical rule. –3 –2 Standard deviations 2 3
68–95–99.7.
(C) 2021 BFW Publishers -- for review purposes only.
Some people refer to the empirical rule result as the 68–95–99.7 rule. By remem-
bering these three numbers, you can quickly estimate the proportion or percent of
observations in a specified interval in a normal distribution.
AL TERNA TE EX AMPLE EXAMPLE
How good is Lexi Thompson?
How can you interpret ITBS vocabulary scores?
Using the empirical rule to estimate areas
Using the empirical rule to estimate areas
PROBLEM: Golfer Lexi Thompson is PROBLEM: The distribution of Iowa Test of Basic Skills (ITBS) Bonnie Jo Mount/The Washington
one of the top golfers on the LPGA tour. vocabulary scores for seventh-grade students in Gary, Indi- Post/Getty Images
The distribution of scores for each of the ana, can be modeled by a normal distribution with µ = 6.84
and σ =1.55 . Use the empirical rule to answer the following
more than 700 rounds over her LPGA questions.
career is approximately normal with (a) What percent of these students have ITBS vocabulary scores less than 3.74?
a mean of about µ = 70.6 strokes and (b) What proportion of Gary, Indiana, seventh-graders have ITBS vocabulary scores between 5.29 and 9.94?
a standard deviation of about σ = 3.2 SOLUTION:
strokes. Use the empirical rule to answer (a)
the following questions. Sketch a normal curve with the mean and the
values 1, 2, and 3 standard deviations from the
(a) What proportion of Thompson’s About 95% mean labeled. Then shade the area of interest.
scores are greater than 73.8?
(b) What percent of Thompson’s scores By the empirical rule, about 95% of all scores
are between 64.2 and 67.4? About 5% / 2 = 2.5% fall between 3.74 and 9.94. The other 5% of
scores are outside this range. Because normal
distributions are symmetric, half of these scores
SOLUTION: are less than 3.74 and half are greater than 9.94.
(a) About 68% of all scores are between 2.19 3.74 5.29 6.84 8.39 9.94 11.49
67.4 and 73.8. That means about ITBS vocabulary score
100% –68% = 32% are either less than About 2.5% of Gary, Indiana, seventh-graders have ITBS
vocabulary scores less than 3.74.
67.4 or greater than 73.8. Because
normal distributions are symmetric,
about 32%/2 16% or 0.16 of Lexi
=
Thompson’s scores are greater than 73.8.
95% –68% = 27% are between 64.2 and 07/09/20 1:55 PM
03_StarnesSPA4e_24432_ch02_088_153.indd 120
67.4 or between 73.8 and 77.0. Because
About 68%
About normal distributions are symmetric, about
100% – 68% 27%/213.5% of all scores are between 64.2
=
2
= 16% and 67.4.
About 68%
61.0 64.2 67.4 70.6 73.8 77.0 80.2
About
Score 95% – 68%
2
(b) By the empirical rule, about 68% = 13.5%
of all scores are between 67.4 ft and
73.8 ft and about 95% are between 61.0 64.2 67.4 70.6 73.8 77.0 80.2
64.2 and 77.0. That means about Score
120 CHAPTER 2 • Modeling One-Variable Quantitative Data
03_TysonTEspa4e_25177_ch02_088_153_4pp.indd 120 10/11/20 7:45 PM