
Page 38 - 2021-bfw-SPA-4e-TE-sample.indd
P. 38
LESSON 2.4 • The Empirical Rule and Assessing Normality 119
Calculating the shaded area isn’t as easy as multiplying baseheight× , but it’s
not as hard as you might think. The following activity will shed some light on how
to do it.
ACTIVITY ACTIVITY OVERVIEW Lesson 2.4
Time: 8–10 min
What’s so special about normal distributions?
Materials: One Internet-connected
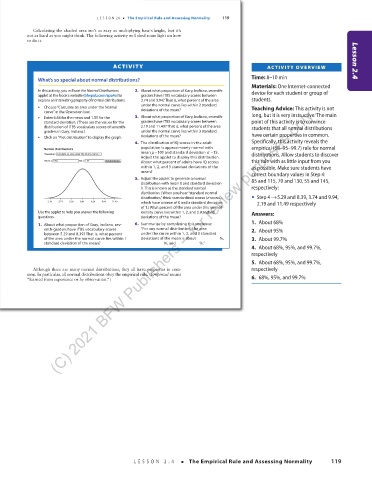
In this activity, you will use the Normal Distributions 2. About what proportion of Gary, Indiana, seventh- device for each student or group of
applet at the book’s website (bfwpub.com/spa4e) to graders have ITBS vocabulary scores between
explore an interesting property of normal distributions. 3.74 and 9.94? That is, what percent of the area students.
(C) 2021 BFW Publishers -- for review purposes only.
• Choose “Calculate an area under the Normal under the normal curve lies within 2 standard Teaching Advice: This activity is not
deviations of the mean?
curve” in the Operation box. long, but it is very instructive. The main
• Enter 6.84 for the mean and 1.55 for the 3. About what proportion of Gary, Indiana, seventh-
standard deviation. (These are the values for the graders have ITBS vocabulary scores between point of this activity is to convince
distribution of ITBS vocabulary scores of seventh- 2.19 and 11.49? That is, what percent of the area students that all normal distributions
graders in Gary, Indiana.) under the normal curve lies within 3 standard have certain properties in common.
• Click on “Plot distribution” to display the graph. deviations of the mean?
4. The distribution of IQ scores in the adult Specifically, this activity reveals the
Normal Distributions population is approximately normal with empirical (68–95–99.7) rule for normal
Operation: Calculate an area under the Normal curve mean µ = 100 and standard deviation σ =15. distributions. Allow students to discover
Adjust the applet to display this distribution.
Mean = 6.84 SD = 1.55 Plot distribution About what percent of adults have IQ scores this rule with as little input from you
within 1, 2, and 3 standard deviations of the as possible. Make sure students have
mean? correct boundary values in Step 4:
5. Adjust the applet to generate a normal 85 and 115, 70 and 130, 55 and 145,
distribution with mean 0 and standard deviation
1. This is known as the standard normal respectively:
distribution. (When you hear “standard normal
distribution,” think standardized scores (z-scores), • Step 4 S5.29 and 8.39, 3.74 and 9.94,
2.19 3.74 5.29 6.84 8.39 9.94 11.49 which have a mean of 0 and a standard deviation 2.19 and 11.49 respectively
of 1.) What percent of the area under this normal
Use the applet to help you answer the following density curve lies within 1, 2, and 3 standard Answers:
questions. deviations of the mean?
1. About what proportion of Gary, Indiana, sev- 6. Summarize by completing this sentence: 1. About 68%
enth-graders have ITBS vocabulary scores “For any normal distribution, the area 2. About 95%
between 5.29 and 8.39? That is, what percent under the curve within 1, 2, and 3 standard
of the area under the normal curve lies within 1 deviations of the mean is about %, 3. About 99.7%
standard deviation of the mean? %, and %.”
4. About 68%, 95%, and 99.7%,
respectively
5. About 68%, 95%, and 99.7%,
Although there are many normal distributions, they all have properties in com- respectively
mon. In particular, all normal distributions obey the empirical rule. (Empirical means 6. 68%, 95%, and 99.7%
“learned from experience or by observation.”)
03_StarnesSPA4e_24432_ch02_088_153.indd 119 07/09/20 1:55 PM
LESSON 2.4 • The Empirical Rule and Assessing Normality 119
03_TysonTEspa4e_25177_ch02_088_153_4pp.indd 119 10/11/20 7:45 PM