
Page 41 - 2021-bfw-SPA-4e-TE-sample.indd
P. 41
122 CHAPTER 2 • Modeling One-Variable Quantitative Data
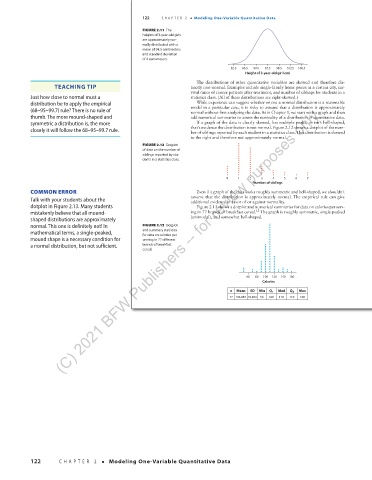
FIGURE 2.11 The
heights of 3-year-old girls
are approximately nor-
mally distributed with a
mean of 94.5 centimeters
and standard deviation
of 4 centimeters.
82.5 86.5 90.5 94.5 98.5 102.5 106.5
Height of 3-year-old girl (cm)
The distributions of other quantitative variables are skewed and therefore dis-
TEACHING TIP tinctly non-normal. Examples include single-family home prices in a certain city, sur-
vival times of cancer patients after treatment, and number of siblings for students in a
Just how close to normal must a statistics class. (All of these distributions are right-skewed.)
distribution be to apply the empirical While experience can suggest whether or not a normal distribution is a reasonable
(C) 2021 BFW Publishers -- for review purposes only.
(68–95–99.7) rule? There is no rule of model in a particular case, it is risky to assume that a distribution is approximately
normal without first analyzing the data. As in Chapter 1, we start with a graph and then
thumb. The more mound-shaped and add numerical summaries to assess the normality of a distribution of quantitative data.
symmetric a distribution is, the more If a graph of the data is clearly skewed, has multiple peaks, or isn’t bell-shaped,
closely it will follow the 68–95–99.7 rule. that’s evidence the distribution is not normal. Figure 2.12 shows a dotplot of the num-
ber of siblings reported by each student in a statistics class. This distribution is skewed
to the right and therefore not approximately normal.
FIGURE 2.12 Dotplot
of data on the number of
siblings reported by stu-
dents in a statistics class.
0 1 2 3 4 5 6 7
Number of siblings
COMMON ERROR Even if a graph of the data looks roughly symmetric and bell-shaped, we shouldn’t
Talk with your students about the assume that the distribution is approximately normal. The empirical rule can give
additional evidence in favor of or against normality.
dotplot in Figure 2.13. Many students Figure 2.13 shows a dotplot and numerical summaries for data on calories per serv-
12
mistakenly believe that all mound- ing in 77 brands of breakfast cereal. The graph is roughly symmetric, single-peaked
shaped distributions are approximately (unimodal), and somewhat bell-shaped.
normal. This one is definitely not! In FIGURE 2.13 Dotplot
mathematical terms, a single-peaked, and summary statistics
for data on calories per
mound shape is a necessary condition for serving in 77 different
a normal distribution, but not sufficient. brands of breakfast
cereal.
60 80 100 120 140 160
Calories
n Mean SD Min Q 1 Med Q 3 Max
77 106.883 19.484 50 100 110 110 160
03_StarnesSPA4e_24432_ch02_088_153.indd 122 07/09/20 1:56 PM
122 CHAPTER 2 • Modeling One-Variable Quantitative Data
03_TysonTEspa4e_25177_ch02_088_153_4pp.indd 122 10/11/20 7:45 PM