
Page 36 - 2021-bfw-SPA-4e-TE-sample.indd
P. 36
LESSON 2.3 • Density Curves and the Normal Distribution 117
24. (a) Skewed to the right
(c) The median of the density curve is between 0.2 and 24. Lead in Flint (1.5, 1.6)
>
0.4. Explain why. (a) Describe the shape of the histogram. (b) Meanmedian because the
(d) Is the mean of the density curve less than, equal to, (b) Which is larger, the mean or median of the distribu- shape is skewed to the right.
or greater than the median of the density curve? tion of lead level? Justify your answer.
>
=
Justify your answer. 25. (a) Yes, 8/710.113 0.10
25. Flint water crisis (2.1) If at least 10 percent of the (b) Because 6/690.087 0.10
=
<
water samples collected by the city have lead levels Lesson 2.3
Recycle and Review exceeding 15 parts per billion, action must be taken.
Exercises 24 and 25 refer to this setting. The city of (a) Based on the distribution of lead level in the 71
Flint, Michigan, has suffered a financial emergency water samples from Flint, should action be taken?
several times in the past 20 years. In April 2014, Justify your answer.
emergency managers decided to save money by using City officials decided to omit the two values marked
water from the Flint River rather than continuing to in red from the data set. The water sample with 20 parts
buy water sourced from Lake Huron. Soon after, Flint per billion of lead came from a business, not a home.
resident Leann Walters noticed orange water coming The water sample with 104 parts per billion came from
(C) 2021 BFW Publishers -- for review purposes only.
out of her taps. Also, her family members’ hair was Leann Walters’s home, which used a water filter.
falling out, and her young children had developed (b) Based on the distribution of lead level in the remain-
rashes. A city employee tested two water samples ing 69 water samples from Flint, explain why city
from Walters’s home and detected lead levels of 104 officials decided not to take action.
parts per billion and 397 parts per billion, many times
higher than the “action” level for lead of 15 parts per Note: Leann Walters and other Flint residents became
billion. The authorities advised Walters’s family to citizen scientists and worked with scientists from
stop drinking the water immediately. However, they Virginia Tech University to re-test the lead level of water
blamed the high lead levels on the pipes in her home in the city’s homes. Their result: more than 10 percent
and insisted that drinking water from the Flint River of the water samples had lead levels of 26.8 parts per
was safe. billion or higher! Authorities agreed that Flint’s water
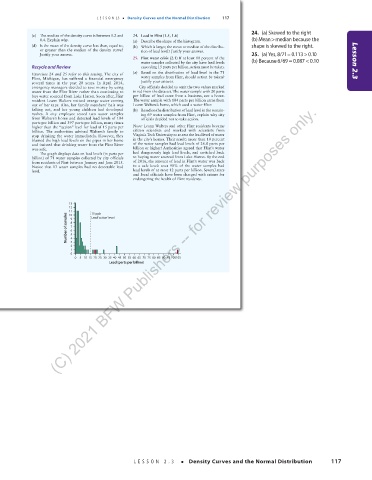
The graph displays data on lead levels (in parts per had dangerously high lead levels, and switched back
billion) of 71 water samples collected by city officials to buying water sourced from Lake Huron. By the end
from residents of Flint between January and June 2015. of 2016, the amount of lead in Flint’s water was back
Notice that 13 water samples had no detectable lead to a safe level: over 90% of the water samples had
level. lead levels of at most 12 parts per billion. Several state
and local officials have been charged with crimes for
endangering the health of Flint residents.
13
12
11 9 15 ppb
Number of samples 8 7 6 5
10
Lead ‘action’ level
2 4 3
1
0
0 5 10 15 20 25 30 35 40 45 50 55 60 65 70 75 80 85 90 95 100105
Lead (parts per billion)
03_StarnesSPA4e_24432_ch02_088_153.indd 117 07/09/20 1:55 PM
LESSON 2.3 • Density Curves and the Normal Distribution 117
03_TysonTEspa4e_25177_ch02_088_153_4pp.indd 117 10/11/20 7:45 PM