
Page 32 - 2021-bfw-SPA-4e-TE-sample.indd
P. 32
LESSON 2.3 • Density Curves and the Normal Distribution 113
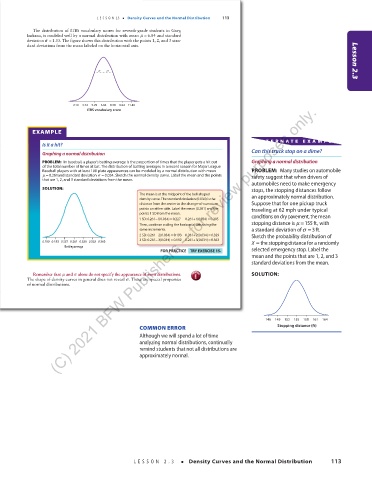
The distribution of ITBS vocabulary scores for seventh-grade students in Gary,
Indiana, is modeled well by a normal distribution with mean µ = 6.84 and standard
deviation σ = 1.55 The figure shows this distribution with the points 1, 2, and 3 stan-
.
dard deviations from the mean labeled on the horizontal axis.
σ σ Lesson 2.3
=review purposes only.
2.19 3.74 5.29 6.84 8.39 9.94 11.49
ITBS vocabulary score
EXAMPLE
AL TERNA TE EX AMPLE
Is it a hit?
Can this truck stop on a dime?
Graphing a normal distribution
PROBLEM: In baseball, a player’s batting average is the proportion of times that the player gets a hit out Graphing a normal distribution
of the total number of times at bat. The distribution of batting averages in a recent season for Major League
Baseball players with at least 100 plate appearances can be modeled by a normal distribution with mean PROBLEM: Many studies on automobile
µ = 0.261 and standard deviation σ = 0.034 . Sketch the normal density curve. Label the mean and the points safety suggest that when drivers of
that are 1, 2, and 3 standard deviations from the mean.
automobiles need to make emergency
SOLUTION: stops, the stopping distances follow
The mean is at the midpoint of the bell-shaped an approximately normal distribution.
density curve. The standard deviation (0.034) is the
distance from the center to the change-of-curvature Suppose that for one pickup truck
points on either side. Label the mean (0.261) and the traveling at 62 mph under typical
+for
points 1 SD from the mean. conditions on dry pavement, the mean
=
1 SD:0.261 −1(0.034)0.227 0.261 1(0.034)0.295
+
Then, continue scaling the horizontal axis using the stopping distance is µ =155 ft, with
(C) 2021 BFW Publishers --
same increments. a standard deviation of σ = 3ft.
=
2SD: 0.261 2(0.034)0.193 0.261 2(0.034)0.329 Sketch the probability distribution of
−
=
=
=
+
3SD: 0.261 3(0.034)0.159 0.261 3(0.034)0.363
−
0.159 0.193 0.227 0.261 0.2950.329 0.363 X = thestoppingdistance for a randomly
Ba ing average selected emergency stop. Label the
FOR PRACTICE TRY EXERCISE 15.
mean and the points that are 1, 2, and 3
standard deviations from the mean.
Remember that µ and σ alone do not specify the appearance of most distributions. caution SOLUTION:
!
aution
.
The shape of density curves in general does not reveal σ These are special properties
of normal distributions.
146 149 152 155 158 161 164
03_StarnesSPA4e_24432_ch02_088_153.indd 113 COMMON ERROR 07/09/20 1:55 PM Stopping distance (ft)
Although we will spend a lot of time
analyzing normal distributions, continually
remind students that not all distributions are
approximately normal.
LESSON 2.3 • Density Curves and the Normal Distribution 113
03_TysonTEspa4e_25177_ch02_088_153_4pp.indd 113 10/11/20 7:44 PM