
Page 29 - 2021-bfw-SPA-4e-TE-sample.indd
P. 29
110 CHAPTER 2 • Modeling One-Variable Quantitative Data
Describing Density Curves
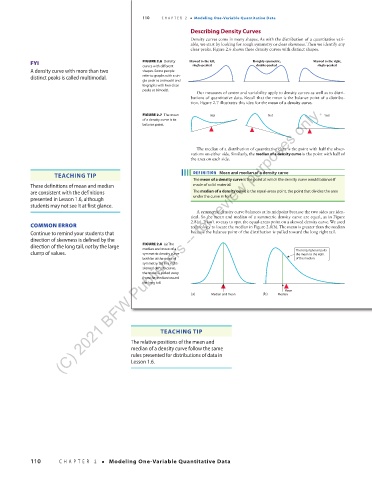
Density curves come in many shapes. As with the distribution of a quantitative vari-
able, we start by looking for rough symmetry or clear skewness. Then we identify any
clear peaks. Figure 2.6 shows three density curves with distinct shapes.
FYI FIGURE 2.6 Density Skewed to the left, Roughly symmetric, Skewed to the right,
double-peaked
single-peaked
single-peaked
curves with different
A density curve with more than two shapes. Some people
distinct peaks is called multimodal. refer to graphs with a sin-
gle peak as unimodal and
to graphs with two clear
peaks as bimodal.
Our measures of center and variability apply to density curves as well as to distri-
butions of quantitative data. Recall that the mean is the balance point of a distribu-
tion. Figure 2.7 illustrates this idea for the mean of a density curve.
(C) 2021 BFW Publishers -- for review purposes only.
FIGURE 2.7 The mean No! No! Yes!
of a density curve is its
balance point.
The median of a distribution of quantitative data is the point with half the obser-
vations on either side. Similarly, the median of a density curve is the point with half of
the area on each side.
TEACHING TIP DEFINITION Mean and median of a density curve
The mean of a density curve is the point at which the density curve would balance if
These definitions of mean and median made of solid material.
are consistent with the definitions The median of a density curve is the equal-areas point, the point that divides the area
presented in Lesson 1.6, although under the curve in half.
students may not see it at first glance.
A symmetric density curve balances at its midpoint because the two sides are iden-
tical. So the mean and median of a symmetric density curve are equal, as in Figure
2.8(a). It isn’t so easy to spot the equal-areas point on a skewed density curve. We used
COMMON ERROR technology to locate the median in Figure 2.8(b). The mean is greater than the median
Continue to remind your students that because the balance point of the distribution is pulled toward the long right tail.
direction of skewness is defined by the
direction of the long tail, not by the large FIGURE 2.8 (a) The
median and mean of a
clump of values. symmetric density curve The long right tail pulls
the mean to the right
both lie at the point of of the median.
symmetry. (b) In a right-
skewed density curve,
the mean is pulled away
from the median toward
the long tail.
Mean
(a) Median and mean (b) Median
03_StarnesSPA4e_24432_ch02_088_153.indd 110 07/09/20 1:55 PM
TEACHING TIP
The relative positions of the mean and
median of a density curve follow the same
rules presented for distributions of data in
Lesson 1.6.
110 CHAPTER 2 • Modeling One-Variable Quantitative Data
03_TysonTEspa4e_25177_ch02_088_153_4pp.indd 110 10/11/20 7:44 PM