Page 30 - 2021-bfw-SPA-4e-TE-sample.indd
P. 30

LESSON 2.3  •   Density Curves and the Normal Distribution  111

                    EXAMPLE                                                                         TEACHING TIP

                        What does the left skew do?                                         In this example, the peak of the
                        Mean versus median                                                  distribution is at point C. That makes C
                                                                                            the mode of the distribution. Students   Lesson 2.3


                          PROBLEM:   A density curve that models the distribution of a quantitative   may have learned that the mode is


                      variable is shown. Identify the location of the mean and median by letter.
                      Justify your answers.                                                 a way to measure center. A better
                         SOLUTION:                                        AB C              understanding of mode is that it is a
                         =
                              =
                             MedianB,MeanA  . B is the equal-areas point of the       Even though C is directly under the peak of the   peak—a point at which there is a high

                      distribution. The mean will be less than the median due to the   curve, more than half of the area is to its left, so it   (or the highest) frequency of values.
                      left-skewed shape.
                                                       cannot be the median.
                                                                                            Mean versus medianonly.
                                                                 FOR PRACTICE TRY     EXERCISE 11.      AL TERNA TE  EX AMPLE
                                                                                            Is it left skewed, too?
                           (C) 2021 BFW Publishers -- for review purposes
                     A density curve is an idealized model for the population distribution of a quanti-

                 tative variable. As a result, we label the mean of a density curve as   µ and the standard
                                    .
                 deviation of a density curve as   σ  We can roughly locate the mean of any density curve   PROBLEM:  A density curve that models
                 by eye, as its balance point. No easy way exists to estimate the standard deviation for
                 density curves in general. But there is one family of density curves for which we can   the distribution of a quantitative variable
                 estimate the standard deviation by eye.                                    is shown. Identify the location of the
                                                                                            mean and median by letter. Justify your
                       Normal Distributions
                                                                                            answers.
                   When  we  examine  a  distribution  of  quantitative  data,  how  does  it  compare  with


                 an  idealized  density  curve?   Figure  2.9(a)  shows  a  histogram  of  the  scores  of  all
                   seventh-grade students in Gary, Indiana, on the vocabulary part of the Iowa Test of
                            11
                 Basic Skills (ITBS).   The scores are grade-level equivalents, so a score of 6.3 indicates

                                                                                                             AB     C
                                                                                            SOLUTION:  This density curve is
                                                                 normal                     skewed to the left. Median B,
                                                                                                               =
                                                                 density
                                                                                                =
                                                                 curve                      MeanA. B is the equal-areas point
                                                                                            of the distribution. The mean (balance
                                                                                            point of the distribution) will be less
                                                                                            than the median due to the left-skewed
                                                                                            shape.
                  2    4    6   8    10   12   2   4    6    8   10   12
                 (a)     ITBS vocabulary score  (b)  ITBS vocabulary score
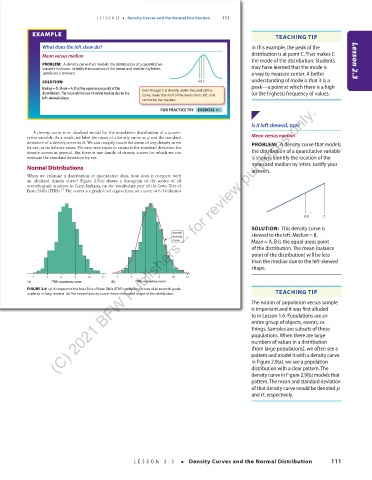
                 FIGURE 2.9     (a) Histogram of the Iowa Test of Basic Skills (ITBS) vocabulary scores of all seventh-grade
                 students in Gary, Indiana. (b) The normal density curve shows the overall shape of the distribution.     TEACHING TIP
                                                                                            The notion of population versus sample
                                                                                            is important and it was first alluded
                                                                                            to in Lesson 1.6. Populations are an
                                                                                            entire group of objects, events, or
        03_StarnesSPA4e_24432_ch02_088_153.indd   111                             07/09/20   1:55 PM
                                                                                            things. Samples are subsets of these
                                                                                            populations. When there are large
                                                                                            numbers of values in a distribution
                                                                                            (from large populations), we often see a
                                                                                            pattern and model it with a density curve.
                                                                                            In Figure 2.9(a), we see a population
                                                                                            distribution with a clear pattern. The
                                                                                            density curve in Figure 2.9(b) models that
                                                                                            pattern. The mean and standard deviation
                                                                                            of that density curve would be denoted µ
                                                                                            and σ, respectively.


                                                    LESSON 2.3   •  Density Curves and the Normal Distribution        111


          03_TysonTEspa4e_25177_ch02_088_153_4pp.indd   111                                                            10/11/20   7:44 PM
   25   26   27   28   29   30   31   32   33   34   35