
Page 46 - 2021-bfw-SPA-4e-TE-sample.indd
P. 46
LESSON 2.4 • The Empirical Rule and Assessing Normality 127
25. Here is a possible dotplot.
23. Women’s heights: Mean and SD The distribution of cookies, and then weighed the amount of cream (in
heights in a population of women is approximately grams) on each cookie. Ryan and Allie doubled the
normal. Sixteen percent of the women have heights weight of cream on each regular Oreo cookie. Here
less than 62 inches. About 97.5% of the women are comparative histograms and summary statistics
have heights less than 71 inches. Use the empirical of the data. 0 5 10 15 20 25 30 35
rule to estimate the mean and standard deviation of 9
the heights in this population. 8 ACT score Lesson 2.4
24. Quiz scores: Mean and SD The distribution of 6 26. (a)
scores on a recent quiz in a large college statistics Frequency 7 5
class is approximately normal. About 2.5% of 4 Number of
the students scored below 25 on the quiz. About 3 2
84% percent of the students scored below 40 on 1 SD from the 1 2 3 4 5
the quiz. Use the empirical rule to estimate the 0 mean
mean and standard deviation of the quiz scores 5.2 5.45.6 5.8 6.0 6.26.4 6.66.8 7.07.2 7.4
in this class. Doubled regular Oreo weight (g) Percent of 0 75 88.89 93.75 96
observations
9
Extending the Concepts 8
25. Making it normal The distribution of ACT Math 6 (b) At least 96% of the values in any
scores in 2019 was approximately normal with Frequency 7 5 distribution must be within 5 standard
a mean of 20.5 and a standard deviation of 5.5. 4 3 deviations of the mean. A value that is
Imagine choosing a random sample of 40 students 2
who took the ACT Math test in 2019. Sketch a pos- 1 5 or more standard deviations from the
sible dotplot of their scores. 0 mean is very unlikely.
5.2 5.45.6 5.86.0 6.26.4 6.6 6.87.0 7.2 7.4
26. Chebyshev’s inequality An interesting result known Double Stuf Oreo weight (g)
as Chebyshev’s inequality says that in any distri- 27. (a) The shape for doubled regular
1 n Mean SD Min Q 1 Med Q 3 Max Oreo weights and for Double Stuf Oreos
bution, at least 100 1− % of the values are
k 2 Doubled are both fairly symmetric. There are no
within k standard deviations of the mean. If =k 2, regular 45 6.301 0.565 5.162 5.881 6.294 6.676 7.46 apparent outliers in either distribution.
Oreos (g)
for example, Chebyshev’s inequality tells us that at Double
1 3 Stuf 45 6.742 0.184 6.37 6.62 6.73 6.875 7.15 The mean cream weight for Double Stuf
least 100 1− = 100 = 75% of the values in Oreos (6.742 g) is greater than that of
2
2 4 Oreos (g)
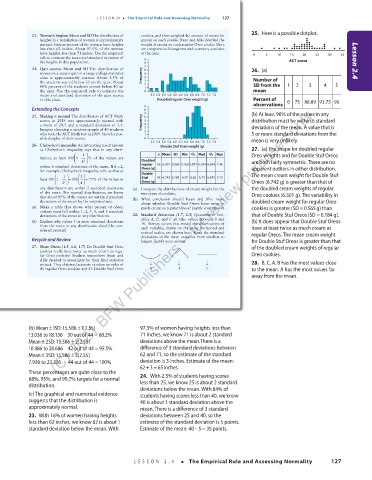
any distribution are within 2 standard deviations (a) Compare the distributions of cream weight for the the doubled cream weights of regular
of the mean. For normal distributions, we know two types of cookies. Oreo cookies (6.301 g). The variability in
that about 95% of the values are within 2 standard (b) What conclusion should Ryan and Allie make
deviations of the mean by the empirical rule. about whether Double Stuf Oreos have twice as doubled cream weight for regular Oreo
(a) Make a table that shows what percent of obser- much cream as regular Oreos? Justify your answer. cookies is greater (SD0.565g) than
=
vations must fall within 1, 2, 3, 4, and 5 standard
=
deviations of the mean in any distribution. 28. Standard deviations ( 1.7, 2.3) Quantitative vari- that of Double Stuf Oreos (SD0.184 g).
(b) Explain why values 5 or more standard deviations ables A, B, and C all take values between 0 and (b) It does appear that Double Stuf Oreos
10. Density curves that model the distributions of
from the mean in any distribution should be con- each variable, drawn on the same horizontal and have at least twice as much cream as
sidered unusual. ±2021 BFW Publishers -- for review purposes only.
vertical scales, are shown here. Rank the standard regular Oreos. The mean cream weight
Recycle and Review deviations of the three variables from smallest to for Double Stuf Oreos is greater than that
largest. Justify your answer.
27. More Oreos (1.5, 1.6, 1.7) Do Double Stuf Oreo of the doubled cream weights of regular
cookies really have twice as much cream as regu-
lar Oreo cookies? Student researchers Ryan and Oreo cookies.
Allie decided to investigate for their final statistics 28. B, C, A. B has the most values close
project. They obtained separate random samples of
45 regular Oreo cookies and 45 Double Stuf Oreo A B C to the mean. A has the most values far
away from the mean.
(b) Mean 1SD:15.586 1(2.55)
±
03_StarnesSPA4e_24432_ch02_088_153.indd 127 ± 97.5% of women having heights less than
07/09/20 1:56 PM
13.036 to18.136 30 outof44 = 68.2% 71 inches, we know 71 is about 2 standard
±
Mean ± 2SD:15.586 2(2.55) deviations above the mean.There is a
(C)
10.486 to 20.686 42 outof44 = 95.5% difference of 3 standard deviations between
Mean ± 3SD:15.586 3(2.55) 62 and 71, so the estimate of the standard
7.936 to 23.236 44 outof44 =100% deviation is 3 inches. Estimate of the mean:
+= 65inches.
These percentages are quite close to the 623
68%, 95%, and 99.7% targets for a normal 24. With 2.5% of students having scores
distribution. less than 25, we know 25 is about 2 standard
deviations below the mean. With 84% of
(c) The graphical and numerical evidence students having scores less than 40, we know
suggests that the distribution is 40 is about 1 standard deviation above the
approximately normal. mean. There is a difference of 3 standard
23. With 16% of women having heights deviations between 25 and 40, so the
less than 62 inches, we know 62 is about 1 estimate of the standard deviation is 5 points.
standard deviation below the mean. With Estimate of the mean: 40–535 points.
=
LESSON 2.4 • The Empirical Rule and Assessing Normality 127
03_TysonTEspa4e_25177_ch02_088_153_4pp.indd 127 10/11/20 7:46 PM