
Page 49 - 2021-bfw-SPA-4e-TE-sample.indd
P. 49
130 CHAPTER 2 • Modeling One-Variable Quantitative Data
TEACHING TIP TECH Finding Areas from Values in a Normal Distribution
CORNER
Consider your students’ access to
technology. If Internet access is available You can use technology to find areas from values in any normal distribution. Let’s use an applet and the TI-83/84 to
confirm our earlier result about the proportion of Gary, Indiana, seventh-graders with ITBS vocabulary scores below
to your students at school and at home, fourth-grade level (i.e., less than 4).
then the applets are very easy and will With technology, we can do the area calculation using the standard normal distribution or the “unstandardized”
run from any Internet-enabled device normal distribution with mean 6.84 and standard deviation 1.55.
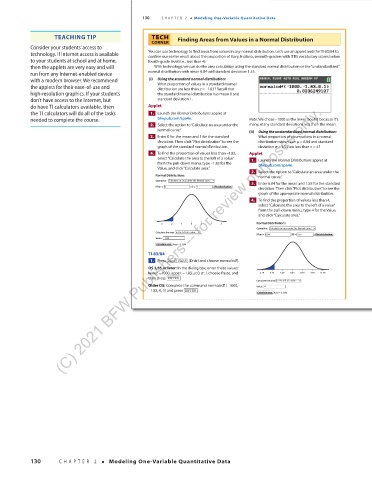
with a modern browser. We recommend (i) Using the standard normal distribution:
the applets for their ease-of-use and What proportion of values in a standard normal
distribution are less than z =−
1.83? Recall that
high-resolution graphics. If your students the standard normal distribution has mean 0 and
don’t have access to the Internet, but standard deviation 1.
(C) 2021 BFW Publishers -- for review purposes only.
do have TI calculators available, then Applet
the TI calculators will do all of the tasks 1. Launch the Normal Distributions applet at
−
needed to complete the course. bfwpub.com/spa4e. Note: We chose 1000 as the lower bound because it’s
2. Select the option to “Calculate an area under the many, many standard deviations less than the mean.
normal curve.” (ii) Using the unstandardized normal distribution:
3. Enter 0 for the mean and 1 for the standard What proportion of observations in a normal
deviation. Then click “Plot distribution” to see the distribution with mean µ = 6.84 and standard
graph of the standard normal distribution. deviation σ =1.55 are less than x = 4?
4. To find the proportion of values less than 1.83− , Applet
select “Calculate the area to the left of a value” 1. Launch the Normal Distributions applet at
−
from the pull-down menu, type 1.83 for the bfwpub.com/spa4e.
Value, and click “Calculate area.”
2. Select the option to “Calculate an area under the
Normal Distributions normal curve.”
Operation: Calculate an area under the Normal curve
3. Enter 6.84 for the mean and 1.55 for the standard
Mean = 0 SD = 1 Plot distribution
deviation. Then click “Plot distribution” to see the
graph of the appropriate normal distribution.
4. To find the proportion of values less than 4,
select “Calculate the area to the left of a value”
from the pull-down menu, type 4 for the Value,
and click “Calculate area.”
–3 –2 –1 0 1 2 3 Normal Distributions
Operation: Calculate an area under the Normal curve
Calculate the area to the left of a value
Mean = 6.84 SD = 1.55 Plot distribution
Value: –1.83
Calculate area Area = 3.36%
TI-83/84
1. Press 2nd VARS (Distr) and choose normalcdf(.
OS 2.55 or later: In the dialog box, enter these values:
lower: −1000, upper: −1.83, µ:0, σ :1, choose Paste, and 2.19 3.74 5.29 6.84 8.39 9.94 11.49
then press ENTER .
Calculate the area to the left of a value
Older OS: Complete the command normalcdf (−1000, Value: 4
−1.83, 0, 1) and press ENTER .
Calculate area Area = 3.35%
03_StarnesSPA4e_24432_ch02_088_153.indd 130 07/09/20 1:56 PM
130 CHAPTER 2 • Modeling One-Variable Quantitative Data
03_TysonTEspa4e_25177_ch02_088_153_4pp.indd 130 10/11/20 7:46 PM