
Page 71 - 2021-bfw-SPA-4e-TE-sample.indd
P. 71
152 CHAPTER 2 • Modeling One-Variable Quantitative Data
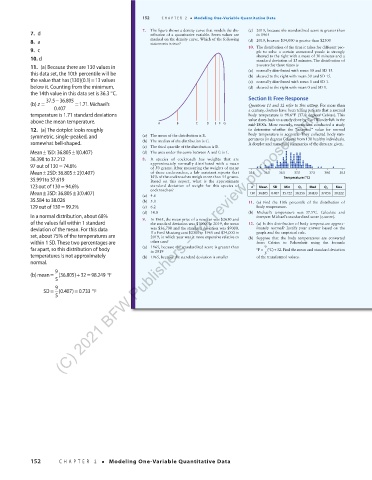
7. The figure shows a density curve that models the dis- (c) 2019, because the standardized score is greater than
7. d tribution of a quantitative variable. Seven values are in 1965
8. a marked on the density curve. Which of the following (d) 2019, because $34,000 is greater than $2300
statements is true?
9. c 10. The distribution of the time it takes for different peo-
ple to solve a certain crossword puzzle is strongly
10. d skewed to the right with a mean of 30 minutes and a
standard deviation of 15 minutes. The distribution of
11. (a) Because there are 130 values in z-scores for those times is
this data set, the 10th percentile will be (a) normally distributed with mean 30 and SD 15.
(b) skewed to the right with mean 30 and SD 15.
=
the value that has (130)(0.1) 13 values (c) normally distributed with mean 0 and SD 1.
below it. Counting from the minimum, (d) skewed to the right with mean 0 and SD 1.
the 14th value in this data set is 36.3 °C.
37.5 −36.805 Section II: Free Response
(b) z = =1.71. Michael’s Questions 11 and 12 refer to this setting. For more than
(C) 2021 BFW Publishers -- for review purposes only.
0.407 a century, doctors have been telling patients that a normal
temperature is 1.71 standard deviations body temperature is 98.6F° (37.0 degrees Celsius). This
above the mean temperature. A B C D E F G value dates back to a study done by Carl Wunderlich in the
mid-1800s. More recently, researchers conducted a study
12. (a) The dotplot looks roughly to determine whether the “accepted” value for normal
symmetric, single-peaked, and (a) The mean of the distribution is E. body temperature is accurate. They collected body tem-
peratures (in degrees Celsius) from 130 healthy individuals.
somewhat bell-shaped. (b) The median of the distribution is C. A dotplot and numerical summaries of the data are given.
(c) The third quartile of the distribution is D.
±
±
Mean 1SD: 36.805 1(0.407) (d) The area under the curve between A and G is 1.
36.398 to 37.212 8. A species of cockroach has weights that are
=
97out of 130 74.6% approximately normally distributed with a mean
of 50 grams. After measuring the weights of many
±
Mean 2SD: 36.805 2(0.407) of these cockroaches, a lab assistant reports that 35.5 36.0 36.5 37.0 37.5 38.0 38.5
±
35.991to 37.619 14% of the cockroaches weigh more than 55 grams. Temperature (°C)
Based on this report, what is the approximate
123outof 130 94.6% standard deviation of weight for this species of n Mean SD Min Q 1 Med Q 3 Max
=
cockroaches?
Mean 3SD: 36.805 3(0.407) (a) 4.6 130 36.805 0.407 35.722 36.556 36.833 37.056 38.222
±
±
35.584 to 38.026 (b) 5.0 11. (a) Find the 10th percentile of the distribution of
129 outof 130 99.2% (c) 6.2 body temperature.
=
(d) 14.0 (b) Michael’s temperature was 37.5C° . Calculate and
In a normal distribution, about 68% interpret Michael’s standardized score (z-score).
of the values fall within 1 standard 9. In 1965, the mean price of a new car was $2650 and 12. (a) Is this distribution of body temperature approx-
the standard deviation was $1000. In 2019, the mean
deviation of the mean. For this data was $36,700 and the standard deviation was $9000. imately normal? Justify your answer based on the
graph and the empirical rule.
set, about 75% of the temperatures are If a Ford Mustang cost $2300 in 1965 and $34,000 in (b) Suppose that the body temperatures are converted
2019, in which year was it more expensive relative to
within 1 SD. These two percentages are other cars? from Celsius to Fahrenheit using the formula
far apart, so this distribution of body (a) 1965, because the standardized score is greater than ° = 9 ° (C)32. Find the mean and standard deviation
+
F
in 2019
5
temperatures is not approximately (b) 1965, because the standard deviation is smaller of the transformed values.
normal.
9
(b) mean = (36.805)32 98.249 F
=
+
°
5
9
=
°
SD = (0.407)0.733 F
5
03_StarnesSPA4e_24432_ch02_088_153.indd 152 07/09/20 1:59 PM
152 CHAPTER 2 • Modeling One-Variable Quantitative Data
03_TysonTEspa4e_25177_ch02_088_153_4pp.indd 152 10/11/20 7:49 PM