
Page 21 - 2021-bfw-SPA-4e-TE-sample.indd
P. 21
102 CHAPTER 2 • Modeling One-Variable Quantitative Data
AL TERNA TE EX AMPLE EXAMPLE
Just one of each color? Too cool at the cabin?
Analyzing the effects of transformations Analyzing the effects of transformations
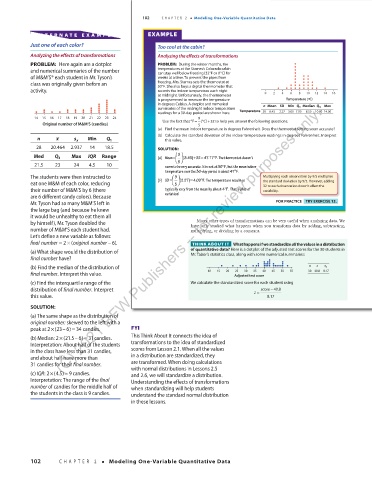
PROBLEM: Here again are a dotplot PROBLEM: During the winter months, the d
and numerical summaries of the number temperatures at the Starnes’s Colorado cabin d d
°
°
can stay well below freezing (32F or 0C) for
of M&M’S® each student in Mr. Tyson’s weeks at a time. To prevent the pipes from d d d d d d d
freezing, Mrs. Starnes sets the thermostat at
class was originally given before an 50 d d d d d d d d d d
°F . She also buys a digital thermometer that
activity. records the indoor temperature each night d d d d d d d d d d
at midnight. Unfortunately, the thermometer 0 2 4 6 8 10 12 14 16
is programmed to measure the temperature Temperature (ºC)
in degrees Celsius. A dotplot and numerical n Mean SD Max
× (C) 2021 BFW Publishers -- for review purposes only.
summaries of the midnight indoor temperature Min Q 1 Median Q 3
readings for a 30-day period are shown here. Temperature 30 8.43 2.27 3.00 7.00 8.50 10.0014.00
14 15 16 17 18 19 20 21 22 23 24 9
+
Original number of M&M’S (candies) Use the fact that ° =F 5 ° (C)32 to help you answer the following questions.
(a) Find the mean indoor temperature in degrees Fahrenheit. Does the thermostat setting seem accurate?
(b) Calculate the standard deviation of the indoor temperature readings in degrees Fahrenheit. Interpret
n x s x Min Q 1 this value.
28 20.464 2.937 14 18.5 SOLUTION:
9
Med Q 3 Max IQR Range (a) Mean = (8.43) +32 47.17 °F. The thermostat doesn’t
=
5
21.5 23 24 4.5 10 seem to be very accurate. It is set at °F , but the mean indoor
50
temperature over the 30-day period is about °47 F .
The students were then instructed to Multiplying each observation by 9/5 multiplies
9
=
SD
eat one M&M of each color, reducing (b) = (2.27) 4.09 °F. The temperature readings the standard deviation by 9/5. However, adding
5
32 to each observation doesn’t affect the
their number of M&M’S by 6 (there typically vary from the mean by about °4F . That’s a lot of variability.
are 6 different candy colors). Because variation!
Mr. Tyson had so many M&M’S left in FOR PRACTICE TRY EXERCISE 13.
the large bag (and because he knew
it would be unhealthy to eat them all
by himself), Mr. Tyson doubled the Many other types of transformations can be very useful when analyzing data. We
number of M&M’S each student had. have only studied what happens when you transform data by adding, subtracting,
multiplying, or dividing by a constant.
Let’s define a new variable as follows:
finalnumber =×2( originalnumber –6). THINK ABOUT IT What happens if we standardize all the values in a distribution
(a) What shape would the distribution of of quantitative data? Here is a dotplot of the adjusted test scores for the 30 students in
final number have? Mr. Tabor’s statistics class, along with some numerical summaries:
d
(b) Find the median of the distribution of d d d d d d d d d d dd d dd d dd d d d d d d d d d d d n x s x
25
35
30
final number. Interpret this value. 10 15 20 Adjusted test score 40 45 50 55 30 40.8 8.17
(c) Find the interquartile range of the We calculate the standardized score for each student using
distribution of final number. Interpret score 40.8
−
this value. z = 8.17
SOLUTION:
(a) The same shape as the distribution of
original number: skewed to the left with a
=
peak at ×2(23–6)34candies. FYI 07/09/20 1:54 PM
03_StarnesSPA4e_24432_ch02_088_153.indd 102
×
=
(b) Median:2 (21.5– 6) 31candies. This Think About It connects the idea of
Interpretation: About half of the students transformations to the idea of standardized
in the class have less than 31 candies, scores from Lesson 2.1. When all the values
and about half have more than in a distribution are standardized, they
31 candies for their final number. are transformed. When doing calculations
with normal distributions in Lessons 2.5
=
(c) IQR :2 (4.5)9 candies. and 2.6, we will standardize a distribution.
Interpretation: The range of the final Understanding the effects of transformations
number of candies for the middle half of when standardizing will help students
the students in the class is 9 candies. understand the standard normal distribution
in these lessons.
102 CHAPTER 2 • Modeling One-Variable Quantitative Data
03_TysonTEspa4e_25177_ch02_088_153_4pp.indd 102 10/11/20 7:43 PM