
Page 17 - 2021-bfw-SPA-4e-TE-sample.indd
P. 17
98 CHAPTER 2 • Modeling One-Variable Quantitative Data
It is sometimes useful to transform data when analyzing the distribution of a quanti-
TEACHING TIP tative variable. We may want to change the units of measurement for a data set from
kilograms to pounds (1 kg ≈ 2.21b), or from Fahrenheit to Celsius °= 5 (F
C
°− 32) .
Point out to your students that 9
computing a standardized score in a Or perhaps a measuring device is calibrated wrong, so we have to add a constant to
distribution is a transformation. When each data value to get accurate measurements. What effect do these kinds of trans-
formations—adding or subtracting; multiplying or dividing—have on the shape,
computing a z-score for a value, we are center, and variability of a distribution?
just subtracting a constant (the mean)
and dividing by a constant (the standard Effect of Adding or Subtracting a Constant
deviation). There are 30 students in Mr. Tabor’s statistics class. He gives them a test worth 50
points. Here is a dotplot of the students’ scores along with some numerical summaries.
d
d d d d
d d dd d d d
(C) 2021 BFW Publishers -- for review purposes only.
FYI d d d d d d d d ddd ddddd d d
10 15 20 25 30 35 40 45 50
Transformations are used for other Score
purposes in statistics, but those −
are generally beyond the scope of n x s x Min Q 1 Med Q 3 Max IQR Range
this book. One example of such a Score 30 35.8 8.17 12 32 37 41 48 9 36
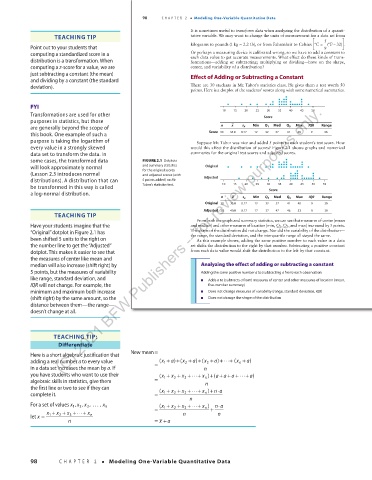
purpose is taking the logarithm of Suppose Mr. Tabor was nice and added 5 points to each student’s test score. How
every value in a strongly skewed would this affect the distribution of scores? Figure 2.1 shows graphs and numerical
data set to transform the data. In summaries for the original test scores and adjusted scores.
some cases, the transformed data FIGURE 2.1 Dotplots d d d d d
will look approximately normal and summary statistics Original d d d d d d d d d ddd d dddd d d d d
d ddd
(Lesson 2.3 introduces normal for the original scores d d d dd d d d d d
d d
and adjusted scores (with
distributions). A distribution that can 5 points added) on Mr. Adjusted d d d d d d d d dd d d ddddd d
be transformed in this way is called Tabor’s statistics test. 10 15 20 25 30 35 40 45 50 55
a log-normal distribution. Score
n − x s x Min Q 1 Med Q 3 Max IQR Range
Original 30 35.8 8.17 12 32 37 41 48 9 36
Adjusted 30 40.8 8.17 17 37 42 46 53 9 36
TEACHING TIP
From both the graph and summary statistics, we can see that measures of center (mean
Have your students imagine that the and median) and other measures of location (min, QQ 3 ,and max) increased by 5 points.
,
1
“Original” dotplot in Figure 2.1 has The shape of the distribution did not change. Nor did the variability of the distribution—
been shifted 5 units to the right on the range, the standard deviation, and the interquartile range all stayed the same.
As this example shows, adding the same positive number to each value in a data
the number line to get the “Adjusted” set shifts the distribution to the right by that number. Subtracting a positive constant
dotplot. This makes it easier to see that from each data value would shift the distribution to the left by that constant.
the measures of center like mean and
median will also increase (shift right) by Analyzing the effect of adding or subtracting a constant
5 points, but the measures of variability Adding the same positive number a to (subtracting a from) each observation:
like range, standard deviation, and ■ Adds a to (subtracts a from) measures of center and other measures of location (mean,
IQR will not change. For example, the five-number summary)
minimum and maximum both increase ■ Does not change measures of variability (range, standard deviation, IQR)
(shift right) by the same amount, so the ■ Does not change the shape of the distribution
distance between them—the range—
doesn’t change at all.
03_StarnesSPA4e_24432_ch02_088_153.indd 98 07/09/20 1:54 PM
TEACHING TIP:
Differentiate
Here is a short algebraic justification that Newmean =
(
adding a real number a to every value = x ( 1 + a) + x( 2 + a) + x( 3 + a) + ⋅⋅⋅+ x n + a)
in a data set increases the mean by a. If n
you have students who want to use their x ( 1 + x 2 + x 3 + ⋅⋅⋅+ x n ) ( +++ ⋅⋅⋅+ a)
+ aaa
algebraic skills in statistics, give them = n
the first line or two to see if they can + ⋅⋅⋅+ x n ) + ⋅ na
complete it. = x ( 1 + x 2 + x 3
n
,. .. x ,
For a set of values x xx, 1 2 , 3 n = x ( 1 + x 2 + x 3 + ⋅⋅⋅+ x n ) + ⋅ na
x + x + x + ⋅⋅⋅+ n n
let x = 1 2 3 x n
x
n =+ a
98 CHAPTER 2 • Modeling One-Variable Quantitative Data
03_TysonTEspa4e_25177_ch02_088_153_4pp.indd 98 10/11/20 7:43 PM