
Page 12 - 2021-bfw-SPA-4e-TE-sample.indd
P. 12
LESSON 2.1 • Describing Location in a Distribution 93
Can we use the standardized score ( z -score) of an individual data value to find its corre- FYI
sponding percentile, or vice versa? The answer is “no” for most distributions. We will intro-
duce a special distribution in Lesson 2.3 for which -scores and percentiles are connected. A z-score is already a comparison: it
z
compares one individual’s value to
Comparing Location in Different Distributions
the mean value. However, z-scores are
How can we compare the locations of values in different distributions of quantitative commonly used to compare two different
data? For instance, Marty had a standing long jump of 71 inches and did 39 sit-ups during individuals with respect to different Lesson 2.1
middle school fitness day. Which performance was better relative to the other students
who participated? Marty’s 71 inches was at the 75th percentile of the distribution of long variables, time periods, or scales.
jump distance, while his 39 was at the 50th percentile of the distribution of sit-ups. So
Marty did better in the standing long jump than at sit-ups relative to his fellow students.
Percentiles are one option for comparing the location of individuals in different AL TERNA TE EX AMPLE
distributions. Standardized scores ( z -scores) are another option if we know the mean
and standard deviation of each distribution. What is Mikaela Shiffrin’s best event?
(C) 2021 BFW Publishers -- for review purposes only.
Comparing location in different distributions
EXAMPLE
PROBLEM: Although early in her skiing
Growing like a beanstalk career, U.S. skier Mikaela Shiffrin is one of
the top skiers in the world, earning many
Comparing location in different distributions
victories including three consecutive
PROBLEM: Jordan (Mr. Tabor’s daughter) was 55 inches tall at age 9. The distribution of height for 9-year-old World Cup wins. In a recent race at
girls has mean 52.5 inches and standard deviation 2.5 inches. Zayne (Mr. Starnes’s grandson) was 58 inches
tall at age 11. The distribution of height for 11-year-old boys has mean 56.5 inches and standard deviation Squaw Valley she won both the slalom
2
3.0 inches. Who is taller relative to other children of their sex and age, Jordan or Zayne? Justify your answer. and giant slalom events. Shiffrin’s time
SOLUTION: in the slalom was 99.480 seconds. The
55 −52.5 58 −56.5 mean time for the slalom was 103.870
Jordan: = =1.0Zayne:z = =0.5 The standardized heights tell us where each seconds with a standard deviation of
z
2.5 3.0 child stands (pun intended!) in the distribution
Jordan is 1 standard deviation above the mean height of 9-year-old of height for her or his age group. 3.247 seconds. In the giant slalom event,
girls, while Zayne is one-half standard deviation above the mean the mean time was 138.711 seconds with
height of 11-year-old boys. So Jordan is taller relative to girls her a standard deviation of 1.109 seconds
age than Zayne is relative to boys his age. FOR PRACTICE TRY EXERCISE 15.
and Shiffrin’s time was 136.42 seconds.
Relative to her competitors, which of
Shiffrin’s two times—the slalom or the
LESSON APP 2 . 1 giant slalom—was better? Justify your
answer. (Hint: Remember that in ski
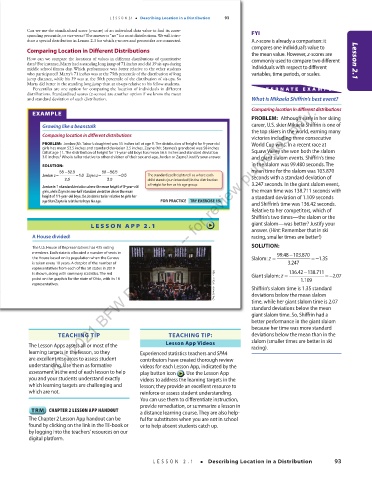
A House divided! racing, smaller times are better!)
The U.S. House of Representatives has 435 voting SOLUTION:
members. Each state is allocated a number of seats in 99.48 −103.870
the House based on its population when the Census Slalom: =z =−1.35
is taken every 10 years. A dotplot of the number of 3.247
representatives from each of the 50 states in 2019
Chip Somodevilla/Getty Images Shiffrin’s slalom time is 1.35 standard
is shown, along with summary statistics. The red Giant slalom: z = 136.42 −138.711 =−2.07
point on the graph is for the state of Ohio, with its 16 1.109
representatives.
deviations below the mean slalom
time, while her giant slalom time is 2.07
standard deviations below the mean
giant slalom time. So, Shiffrin had a
better performance in the giant slalom
03_StarnesSPA4e_24432_ch02_088_153.indd 93 07/09/20 1:54 PM because her time was more standard
TEACHING TIP TEACHING TIP: deviations below the mean than in the
The Lesson Apps assess all or most of the Lesson App Videos slalom (smaller times are better in ski
racing).
learning targets in the lesson, so they Experienced statistics teachers and SPA4
are excellent resources to assess student contributors have created thorough review
understanding. Use them as formative videos for each Lesson App, indicated by the
assessment at the end of each lesson to help play button icon . Use the Lesson App
you and your students understand exactly videos to address the learning targets in the
which learning targets are challenging and lesson; they provide an excellent resource to
which are not. reinforce or assess student understanding.
You can use them to di erentiate instruction,
provide remediation, or summarize a lesson in
CHAPTER 2 LESSON APP HANDOUT a distance learning course. They are also help-
The Chapter 2 Lesson App handout can be ful for substitutes when you are not in school
found by clicking on the link in the TE-book or or to help absent students catch up.
by logging into the teachers’ resources on our
digital platform.
LESSON 2.1 • Describing Location in a Distribution 93
03_TysonTEspa4e_25177_ch02_088_153_4pp.indd 93 10/11/20 7:42 PM