
Page 13 - 2021-bfw-SPA-4e-TE-sample.indd
P. 13
94 CHAPTER 2 • Modeling One-Variable Quantitative Data
LESSON APP 2.1 Answers d d d d d d d d d d d d d d d d d d d d d d d d d d d d d d d
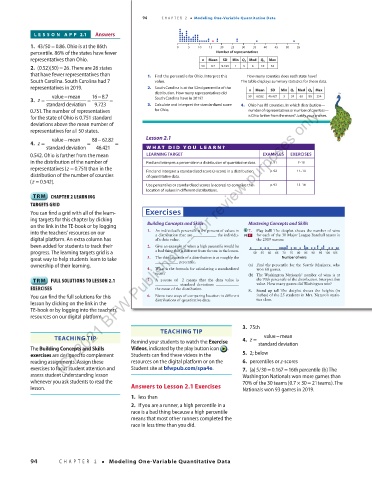
1. 43/50 0.86. Ohio is at the 86th 0 d d d 5 d d d d d d 10 d d d 15 d d d d 20 25 d 30 35 d 40 45 50 d 55
=
percentile. 86% of the states have fewer Number of representatives
representatives than Ohio. n Mean SD Min Q 1 Med Q 3 Max
=
2. (0.52)(50) 26. There are 26 states 50 8.7 9.723 1 3 6 10 53
that have fewer representatives than 1. Find the percentile for Ohio. Interpret this How many counties does each state have?
South Carolina. South Carolina had 7 value. The table displays summary statistics for these data.
representatives in 2019. 2. South Carolina is at the 52nd percentile of the n Mean SD Min Q 1 Med Q 3 Max
distribution. How many representatives did
valuemean 16 −8.7 50 62.82 46.421 3 24 63 88 254
−
3. =z = = South Carolina have in 2019?
standard deviation 9.723 3. Calculate and interpret the standardized score 4. Ohio has 88 counties. In which distribution—
(C) 2021 BFW Publishers -- for review purposes only.
0.751. The number of representatives for Ohio. number of representatives or number of counties—
for the state of Ohio is 0.751 standard is Ohio farther from the mean? Justify your answer.
deviations above the mean number of
representatives for all 50 states.
−
valuemean 88 −62.82 Lesson 2.1
4. =z = =
standarddeviation 46.421 WHA T DID Y OU LEARN ?
0.542. Ohio is farther from the mean LEARNING TARGET EXAMPLES EXERCISES
in the distribution of the number of Find and interpret a percentile in a distribution of quantitative data. p. 91 7–10
representatives z =( 0.751) than in the p. 92 11–14
distribution of the number of counties Find and interpret a standardized score ( z -score) in a distribution
of quantitative data.
( z = 0.542).
Use percentiles or standardized scores ( z -scores) to compare the p. 93 15–18
location of values in different distributions.
CHAPTER 2 LEARNING
TARGETS GRID
You can nd a grid with all of the learn- Exercises
ing targets for this chapter by clicking
on the link in the TE-book or by logging Building Concepts and Skills Mastering Concepts and Skills
7.
into the teachers’ resources on our 1. An individual’s percentile is the percent of values in pg 91 Play ball! The dotplot shows the number of wins
a distribution that are
for each of the 30 Major League Baseball teams in
the individu-
digital platform. An extra column has al’s data value. the 2019 season:
been added for students to track their 2. Give an example of when a high percentile would be d d d d
d
progress. The learning targets grid is a a bad thing that is different from the one in the lesson. d 50 55 d 60 d d 65 70 dddddd 75 dd d 80 d ddd d 90 d d 95 100 105 dd
d d
d
85
great way to help students learn to take 3. The third quartile of a distribution is at roughly the Number of wins
ownership of their learning. percentile. (a) Find the percentile for the Seattle Mariners, who
4. What is the formula for calculating a standardized won 68 games.
score? (b) The Washington Nationals’ number of wins is at
FULL SOLUTIONS TO LESSON 2.1 5. A z -score of 2− means that the data value is the 70th percentile of the distribution. Interpret this
value. How many games did Washington win?
standard deviations
EXERCISES the mean of the distribution. 8. Stand up tall The dotplot shows the heights (in
You can find the full solutions for this 6. Name two ways of comparing location in different inches) of the 25 students in Mrs. Nataro’s statis-
lesson by clicking on the link in the distributions of quantitative data. tics class.
TE-book or by logging into the teachers’
resources on our digital platform.
03_StarnesSPA4e_24432_ch02_088_153.indd 94 3. 75th 07/09/20 1:54 PM
TEACHING TIP
−
TEACHING TIP 4. z = valuemean
Remind your students to watch the Exercise standarddeviation
The Building Concepts and Skills Videos, indicated by the play button icon .
exercises are designed to complement Students can find these videos in the 5. 2; below
reading assignments. Assign these resources on the digital platform or on the 6. percentiles or z-scores
exercises to focus student attention and Student site at bfwpub.com/spa4e. 7. (a) 5/300.167 16thpercentile (b) The
=
=
assess student understanding lesson Washington Nationals won more games than
whenever you ask students to read the 70% of the 30 teams (0.7 30 21teams). The
×
=
lesson. Answers to Lesson 2.1 Exercises Nationals won 93 games in 2019.
1. less than
2. If you are a runner, a high percentile in a
race is a bad thing because a high percentile
means that most other runners completed the
race in less time than you did.
94 CHAPTER 2 • Modeling One-Variable Quantitative Data
03_TysonTEspa4e_25177_ch02_088_153_4pp.indd 94 10/11/20 7:42 PM