
Page 11 - 2021-bfw-SPA-4e-TE-sample.indd
P. 11
92 CHAPTER 2 • Modeling One-Variable Quantitative Data
Finding and Interpreting Standardized Scores ( z -Scores)
TEACHING TIP A percentile is one way to describe an individual’s location in a distribution of quanti-
tative data. Another way is to give the standardized score ( z -score) for the individual’s
Students are unlikely to have prior location.
experience with z-scores and their
interpretation. Work through a few DEFINITION Standardized score ( z -score)
examples with them. As you talk with
students, alternate the terms z-score The standardized score ( z -score ) for an individual value in a distribution tells us how
many standard deviations from the mean the value falls, and in what direction. To find
and standardized score to get them the standardized score ( z -score), compute
accustomed to both. valuemean
−
z =
standarddeviation
COMMON ERROR
(C) 2021 BFW Publishers -- for review purposes only.
Make sure students include direction Values larger than the mean have positive z -scores. Values smaller than the mean
when interpreting z-scores. It is have negative z -scores.
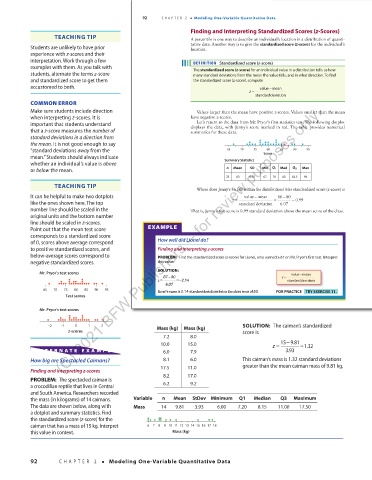
important that students understand Let’s return to the data from Mr. Pryor’s first statistics test. The following dotplot
that a z-score measures the number of displays the data, with Jenny’s score marked in red. The table provides numerical
summaries for these data.
standard deviations in a direction from
the mean. It is not good enough to say
“standard deviations away from the 65 70 75 80 85 90 95
mean.” Students should always indicate Score
whether an individual’s value is above Summary Statistics
or below the mean. n Mean SD Min Q 1 Med Q 3 Max
25 80 6.07 67 76 80 83.5 93
TEACHING TIP
Where does Jenny’s 86 fall within the distribution? Her standardized score ( -score) is
z
It can be helpful to make two dotplots value mean 86 80
−
−
099
like the ones shown here. The top z = standard deviation = 607 =.
.
number line should be scaled in the That is, Jenny’s test score is 0.99 standard deviation above the mean score of the class.
original units and the bottom number
line should be scaled in z-scores.
Point out that the mean test score EXAMPLE
corresponds to a standardized score
of 0, scores above average correspond How well did Lionel do?
to positive standardized scores, and Finding and interpreting z -scores
below-average scores correspond to PROBLEM: Find the standardized score ( z -score) for Lionel, who earned a 67 on Mr. Pryor’s first test. Interpret
negative standardized scores. this value.
SOLUTION:
Mr. Pryor’s test scores 67 80 z = valuemean
−
−
d d z = =− 2.14 standarddeviation
d d dd d
d dddd dddddddddd dd d 6.07
65 70 75 80 85 90 95 Lionel’s score is 2.14 standard deviations below the class mean of 80. FOR PRACTICE TRY EXERCISE 11.
Test scores
Mr. Pryor’s test scores
d d
d d dd d
d dddd dddddddddd dd d
–2 –1 0 1 2 03_StarnesSPA4e_24432_ch02_088_153.indd 92 SOLUTION: The caiman’s standardized 07/09/20 1:53 PM
Mass (kg)
Mass (kg)
z-scores score is
7.2 8.0
10.0 15.0 z = 15 −9.81 ≈1.32
AL TERNA TE EX AMPLE 6.0 7.9 3.93
How big are Spectacled Caimans? 8.1 6.0 This caiman’s mass is 1.32 standard deviations
17.5 11.0 greater than the mean caiman mass of 9.81 kg.
Finding and interpreting z-scores
8.2 17.0
PROBLEM: The spectacled caiman is
a crocodilian reptile that lives in Central 6.2 9.2
and South America. Researchers recorded
the mass (in kilograms) of 14 caimans. Variable n Mean StDev Minimum Q1 Median Q3 Maximum
The data are shown below, along with Mass 14 9.81 3.93 6.00 7.20 8.15 11.00 17.50
a dotplot and summary statistics. Find
the standardized score (z-score) for the d d d d dd d d d d dd
dd
caiman that has a mass of 15 kg. Interpret 6 7 8 9101112131415161718
this value in context. Mass (kg)
92 CHAPTER 2 • Modeling One-Variable Quantitative Data
03_TysonTEspa4e_25177_ch02_088_153_4pp.indd 92 10/11/20 7:42 PM