
Page 10 - 2021-bfw-SPA-4e-TE-sample.indd
P. 10
LESSON 2.1 • Describing Location in a Distribution 91
,
value? Because 30/43 = 0.698 we say that this individual is at the 69th percentile of
the distribution. We can’t say 70th percentile because only 69.8% of the values in the CHAPTER 2 ALTERNATE
data set are less than this individual’s data value.
EXAMPLES
You can find the Alternate Examples in
EXAMPLE Microsoft Word format for every lesson in
this chapter by clicking on the link in the Lesson 2.1
What are the results of the first test? TE-book or by logging into the teachers’
resources on our digital platform.
Finding and interpreting percentiles
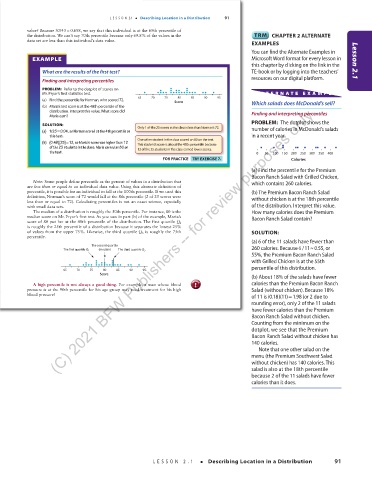
PROBLEM: Refer to the dotplot of scores on d d d d d d d
Mr. Pryor’s first statistics test. d d dd d d dddddd dd d d d d AL TERNA TE EX AMPLE
65 70 75 80 85 90 95
(a) Find the percentile for Norman, who scored 72. Score Which salads does McDonald’s sell?
(b) Maria’s test score is at the 48th percentile of the
distribution. Interpret this value. What score did Finding and interpreting percentiles
Maria earn?
PROBLEM: The dotplot shows the
SOLUTION: Only 1 of the 25 scores in the class is less than Norman’s 72.
=
(a) 1/250.04 , so Norman scored at the 4th percentile on number of calories in McDonald’s salads
this test. in a recent year.
(b) (0.48)(25) =12 , so Maria’s score was higher than 12 One other student in the class scored an 80 on the test.
This student’s score is also at the 48th percentile because
of the 25 students in the class. Maria earned an 80 on 12 of the 25 students in the class earned lower scores.
the test. 0 50 100 150 200 250 300 350 400
FOR PRACTICE TRY EXERCISE 7. Calories
(a) Find the percentile for the Premium
Bacon Ranch Salad with Grilled Chicken,
Note: Some people define percentile as the percent of values in a distribution that which contains 260 calories.
are less than or equal to an individual data value. Using this alternate definition of
percentile, it is possible for an individual to fall at the 100th percentile. If we used this (b) The Premium Bacon Ranch Salad
definition, Norman’s score of 72 would fall at the 8th percentile (2 of 25 scores were without chicken is at the 18th percentile
less than or equal to 72). Calculating percentiles is not an exact science, especially
with small data sets. of the distribution. Interpret this value.
The median of a distribution is roughly the 50th percentile. For instance, 80 is the How many calories does the Premium
median score on Mr. Pryor’s first test. As you saw in part (b) of the example, Maria’s Bacon Ranch Salad contain?
Q
score of 80 put her at the 48th percentile of the distribution. The first quartile 1
is roughly the 25th percentile of a distribution because it separates the lowest 25%
Q
.
of values from the upper 75% Likewise, the third quartile 3 is roughly the 75th SOLUTION:
percentile. (C) 2021 BFW Publishers -- for review purposes only.
(a) 6 of the 11 salads have fewer than
The second quartile 260 calories. Because 6 /110.55, or
≈
The first quartile Q 1 (median) The third quartile Q 3
55%, the Premium Bacon Ranch Salad
d d with Grilled Chicken is at the 55th
d d d d d
d d dd d d dd dd dd dd d d d d percentile of this distribution.
65 70 75 80 85 90 95
Score
(b) About 18% of the salads have fewer
!
A high percentile is not always a good thing. For example, a man whose blood caution calories than the Premium Bacon Ranch
aution
pressure is at the 90th percentile for his age group may need treatment for his high Salad (without chicken). Because 18%
blood pressure! of 11 is (0.18)(11) 1.98 (or 2 due to
=
rounding error), only 2 of the 11 salads
have fewer calories than the Premium
Bacon Ranch Salad without chicken.
Counting from the minimum on the
03_StarnesSPA4e_24432_ch02_088_153.indd 91 07/09/20 1:53 PM
dotplot, we see that the Premium
Bacon Ranch Salad without chicken has
140 calories.
Note that one other salad on the
menu (the Premium Southwest Salad
without chicken) has 140 calories. This
salad is also at the 18th percentile
because 2 of the 11 salads have fewer
calories than it does.
LESSON 2.1 • Describing Location in a Distribution 91
03_TysonTEspa4e_25177_ch02_088_153_4pp.indd 91 10/11/20 7:42 PM