
Page 9 - 2021-bfw-SPA-4e-TE-sample.indd
P. 9
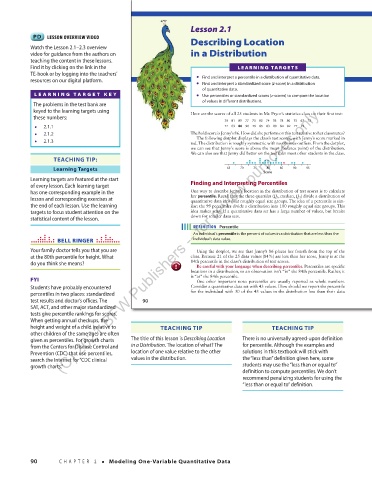
Lesson   2.1
                      LESSON OVERVIEW VIDEO                          Describing Location
                Watch the Lesson 2.1–2.3 overview
                video for guidance from the authors on               in a Distribution
                teaching the content in these lessons.
                Find it by clicking on the link in the                                  L E AR N I N G   TAR G E T S
                TE-book or by logging into the teachers’

                resources on our digital platform.                     •   Find and interpret a percentile in a distribution of quantitative data.
                                                                       •   Find and interpret a standardized score ( z -score) in a distribution

                                                                         of quantitative data.
                 LEARNING  T AR GET   KEY                              •   Use percentiles or standardized scores ( z -scores) to compare the location

                                                                         of values in different distributions.
                 The problems in the test bank are
                           (C) 2021 BFW Publishers -- for review purposes only.
                 keyed to the learning targets using
                 these numbers:                                        Here are the scores of all 25 students in Mr. Pryor’s statistics class on their first test:
                                                                                       79 81 80 77 73 83 74 93 78 80 75 67 73
                 •   2.1.1                                                         77  83   86  90 79 85 83 89 84 82 77 72
                 •   2.1.2                                             The bold score is Jenny’s 86. How did she perform on this test relative to her classmates?
                                                                         The following dotplot displays the class’s test scores, with Jenny’s score marked in
                 •   2.1.3                                           red. The distribution is roughly symmetric with no obvious outliers. From the dotplot,
                                                                     we can see that Jenny’s score is above the mean (balance point) of the distribution.
                                                                     We can also see that Jenny did better on the test than most other students in the class.
                        TEACHING TIP:                                                    d  d d  d  d  d d
                                                                                    d   d dd d  d dddddd dd d  dd  d
                        Learning Targets                                          65  70  75   80  85   90  95
                                                                                              Score
                Learning targets are featured at the start
                of every lesson. Each learning target                      Finding and Interpreting Percentiles
                has one corresponding example in the                   One way to describe Jenny’s location in the distribution of test scores is to calculate
                                                                                                           Q
                                                                                                   ,

                                                                                                   Q


                lesson and corresponding exercises at                her   percentile. Recall that the three quartiles (  1   median,   3  ) divide a distribution of
                                                                     quantitative data into four roughly equal size groups. The idea of a percentile is sim-
                the end of each lesson. Use the learning             ilar: the 99 percentiles divide a distribution into 100 roughly equal size groups. This
                targets to focus student attention on the            idea makes sense if a quantitative data set has a large number of values, but breaks
                statistical content of the lesson.                   down for smaller data sets.
                                                                            DEFINITION  Percentile
                                                                        An individual’s  percentile  is the percent of values in a distribution that are less than the
                          BELL RINGER                                 individual’s data value.
                Your family doctor tells you that you are                Using the dotplot, we see that Jenny’s 86 places her fourth from the top of the


                at the 80th percentile for height. What              class. Because 21 of the 25 data values   (84%) are less than her score, Jenny is at the
                do you think she means?                         caution  84th percentile in the class’s distribution of test scores.
                                                                !         Be careful with your language when describing percentiles. Percentiles are specific
                                                                aution
                                                                     locations in a distribution, so an observation isn’t “in” the 84th percentile. Rather, it
                FYI                                                  is “at” the 84th percentile.
                                                                         One  other  important  note:  percentiles  are  usually  reported  as  whole  numbers.
                Students have probably encountered                   Consider a quantitative data set with 43 values. How should we report the percentile
                percentiles in two places: standardized              for the individual with 30 of the 43 values in the distribution less than their data
                test results and doctor’s offices. The   90
                SAT, ACT, and other major standardized
                tests give percentile rankings for scores.
                When getting annual checkups, the
                height and weight of a child (relative to   03_StarnesSPA4e_24432_ch02_088_153.indd   90  TEACHING TIP     07/09/20   1:53 PM
                                                           TEACHING TIP
                other children of the same age) are often
                given as percentiles. For growth charts   The title of this lesson is Describing Location   There is no universally agreed-upon definition
                from the Centers for Disease Control and   in a Distribution. The location of what? The   for percentile. Although the examples and
                Prevention (CDC) that use percentiles,   location of one value relative to the other   solutions in this textbook will stick with
                search the Internet for “CDC clinical   values in the distribution.    the “less than” definition given here, some
                growth charts.”                                                        students may use the “less than or equal to”
                                                                                       definition to compute percentiles. We don’t
                                                                                       recommend penalizing students for using the
                                                                                       “less than or equal to” definition.


                90        CHAPTER 2   •   Modeling One-Variable Quantitative Data


          03_TysonTEspa4e_25177_ch02_088_153_4pp.indd   90                                                             10/11/20   7:42 PM