
Page 22 - 2021-bfw-SPA-4e-TE-sample.indd
P. 22
LESSON 2.2 • Transforming Data 103
In other words, we subtract 40.8 from each student’s adjusted test score and then divide FYI
by 8.17. What effect do these transformations have on the shape, center, and variability Transformations to distributions that
of the distribution? involve only addition, subtraction,
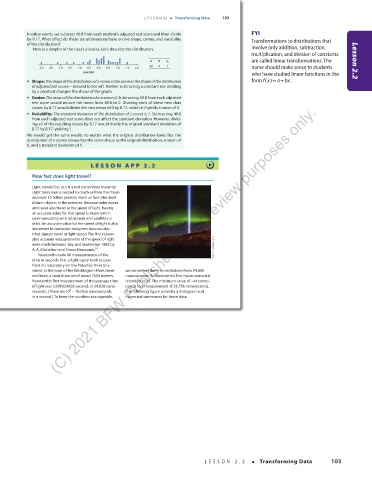
Here is a dotplot of the class’s z -scores. Let’s describe the distribution.
multiplication, and division of constants
d
n x s x are called linear transformations. The Lesson 2.2
d
d
d d
d
d d d
d
d
d
d
d
d
d
d
d
d d
d
d d d
d
d
d
d
d d
30 0 1 name should make sense to students
–3.0 –2.5 –2.0 –1.5 –1.0 –0.5 0.0 0.5 1.0 1.5 2.0
z-score who have studied linear functions in the
• Shape: The shape of the distribution of z-scores is the same as the shape of the distribution form fx =+() abx.
of adjusted test scores —skewed to the left. Neither subtracting a constant nor dividing
by a constant changes the shape of the graph.
• Center: The mean of the distribution of z-scores is 0. Subtracting 40.8 from each adjusted
test score would reduce the mean from 40.8 to 0. Dividing each of these new data
(C) 2021 BFW Publishers -- for review purposes only.
values by 8.17 would divide the new mean of 0 by 8.17, which still yields a mean of 0.
• Variability: The standard deviation of the distribution of z-scores is 1. Subtracting 40.8
from each adjusted test score does not affect the standard deviation. However, divid-
ing all of the resulting values by 8.17 would divide the original standard deviation of
8.17 by 8.17, yielding 1.
We would get the same results no matter what the original distribution looks like: the
distribution of z-scores always has the same shape as the original distribution, a mean of
0, and a standard deviation of 1.
LESSON APP 2 . 2
How fast does light travel?
Light travels fast, but it is not transmitted instantly.
Light takes over a second to reach us from the moon
and over 12 billion years to reach us from the most
distant objects in the universe. Because radio waves
and radar also travel at the speed of light, having
an accurate value for that speed is important in
communicating with astronauts and satellites in
orbit. An accurate value for the speed of light is also
important to computer designers because elec-
trical signals travel at light speed. The first reason-
ably accurate measurements of the speed of light
were made between July and September 1882 by
10
A. A. Michelson and Simon Newcomb. ARCTIC IMAGES/Alamy
Newcomb made 66 measurements of the
time in seconds that a light signal took to pass
from his laboratory on the Potomac River to a
mirror at the base of the Washington Monument we converted them to deviations from 24,800
and back, a total distance of about 7400 meters. nanoseconds. So Newcomb’s first measurement is
Newcomb’s first measurement of the passage time recorded as 28. The minimum value of 44− corres-
of light was 0.000024828 second, or 24,828 nano- ponds to a measurement of 24,756 nanoseconds.
seconds. (There are 10 = 1 billion nanoseconds The following figure provides a histogram and
9
in a second.) To keep the numbers manageable, numerical summaries for these data.
03_StarnesSPA4e_24432_ch02_088_153.indd 103 07/09/20 1:54 PM
LESSON 2.2 • Transforming Data 103
03_TysonTEspa4e_25177_ch02_088_153_4pp.indd 103 10/11/20 7:43 PM